Silver Price Forecast: XAG/USD Hovers Around $31.00, Seems Vulnerable Near Multi-Week Low

Image Source: Pixabay
- Silver remains under some selling pressure on Thursday and hangs near a three-week low.
- The recent breakdown below key technical levels supports prospects for additional losses.
- Any attempted recovery might now be seen as a selling opportunity and remain capped.
Silver (XAG/USD) trades with negative bias for the second straight day on Thursday and languishes near the $31.00 mark, just above its lowest level since mid-October touched the previous day.
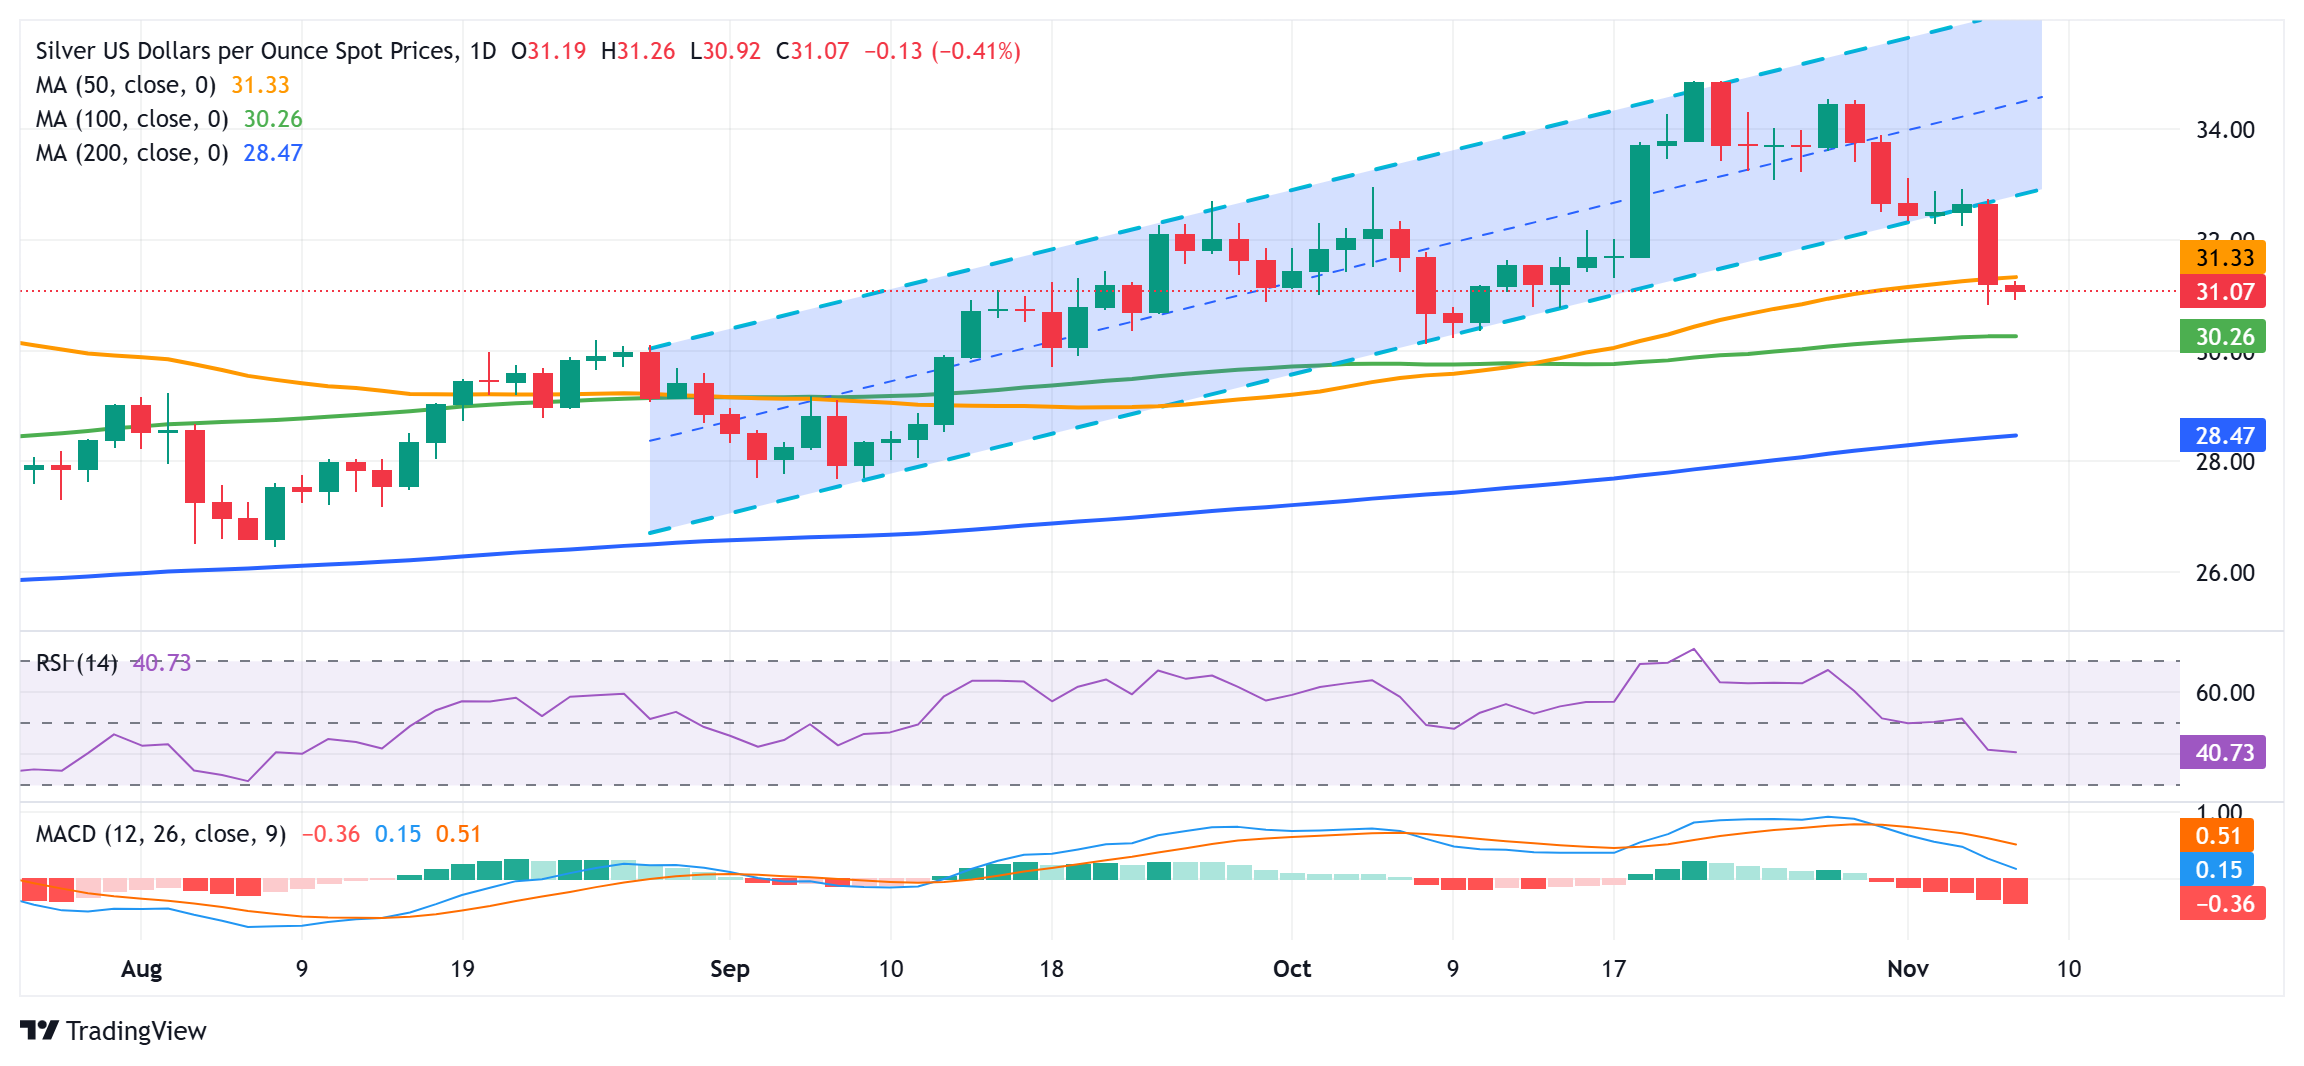
From a technical perspective, the overnight decline confirmed a short-term ascending trend-channel breakdown. A subsequent slide below the 50-day Simple Moving Average (SMA) was seen as a fresh trigger for bearish traders. Furthermore, oscillators on the daily chart have been gaining negative traction and suggest that the path of least resistance for the XAG/USD remains to the downside.
Hence, some follow-through weakness towards testing the 100-day SMA support, currently pegged near the $30.40-$30.35 area, looks like a distinct possibility. The downfall could eventually drag the XAG/USD below the $30.00 psychological mark, toward the next relevant support near the $29.70 zone en route to the $29.00 round figure and the key 200-day SMA, around the $28.55 region.
On the flip side, the 50-day SMA breakpoint, near the $31.40 area, now seems to act as an immediate hurdle, above which a bout of a short-covering move could allow the XAG/USD to reclaim the $32.00 mark. Any further move up, however, might be seen as a selling opportunity and runs the risk of fizzling out rather quickly near the ascending channel support breakpoint, around the $32.65 region.
The latter should act as a key pivotal point, which if cleared decisively will suggest that the recent corrective slide from the vicinity of the $35.00 psychological mark, or a 12-year high touched in October is over. This, in turn, might shift the near-term bias in favor of bullish traders and lift the XAG/USD beyond the $33.00 round figure, towards the $33.60-$33.70 static resistance zone.
Silver daily chart
More By This Author:
EUR/JPY Price Prediction: Continues To Pullback To Trendline For Sept-Oct RallyNZD/USD Trends Lower After Trump Victory And Weak NZ Employment Data
AUD/USD Rebounds From Multi-month Low, Finds Support Ahead Of 0.6500 Mark
Information on these pages contains forward-looking statements that involve risks and uncertainties. Markets and instruments profiled on this page are for informational purposes only and should not ...
more


