Silver Price Forecast: XAG/USD Extends Recovery To $30.60 On Firm Fed Rate-Cut Prospects

Image Source: Pixabay
- Silver price rises to $30.60 as US yields fall on backfoot amid firm Fed rate-cut bets.
- Fed rate-cut bets for September have been prompted by easing US labor market strength.
- Investors shift focus to the US NFP report for May for fresh guidance.
Silver price (XAG/USD) recovers further to $30.60 in Thursday’s Asian session. The white metal discovers strong buying interest as normalizing United States (US) labor market conditions boost speculation that the Federal Reserve (Fed) will start reducing interest rates in the September meeting.
The CME FedWatch tool shows that traders see a 68% chance for rate cuts in September. The probability has significantly improved from 47% recorded a week ago. This has weighed heavily on US bond yields. 10-year US Treasury yields are slightly up to near 4.29% but have come down significantly from weekly high of 4.64%. A sharp decline in yields on interest bearing assets reduces the opportunity cost of holding an investment in non-yielding assets, such as Silver.
Investors lose confidence over US labor market strength after weak JOLTS Job Openings data for April and lower-than-expected ADP Employment Change for May.
The US Dollar Index (DXY) falls sharply after failing to extend recovery above 104.40 but holds the immediate support of 104.00. The next move in above-mentioned assets will be influenced by the US Nonfarm Payrolls (NFP) report for May, which will be published on Friday.
Silver technical analysis
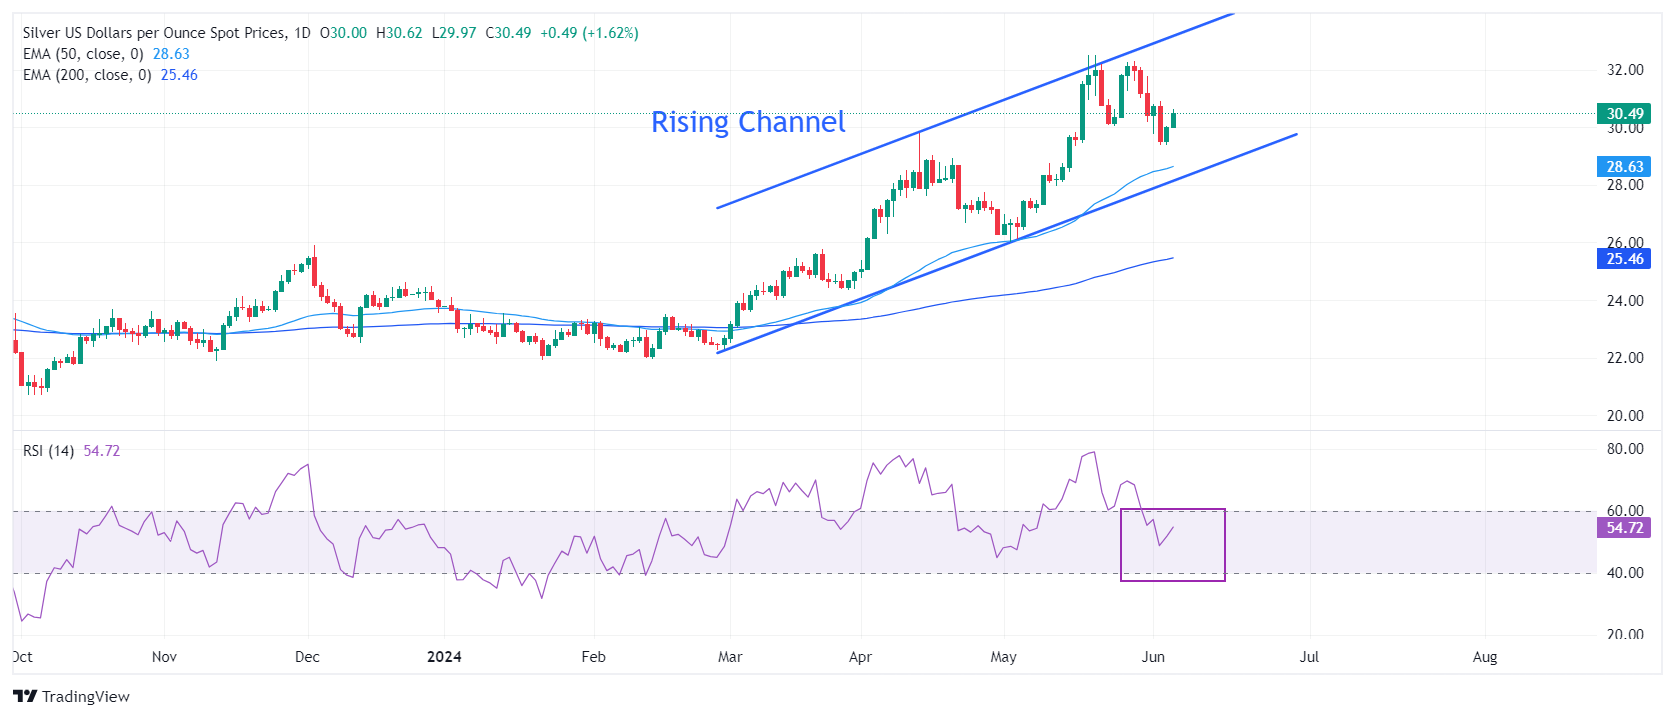
Silver price trades in a Rising Channel chart formation on a daily timeframe in which each pullback is considered as buying opportunity by market participants. Advancing 50 and 200-day Exponential Moving Averages (EMAs) around $28.63 and $25.46, respectively, indicate that the overall trend is bullish.
The 14-period Relative Strength Index (RSI) falls back into the 40.00-60.00 range, suggesting that upside momentum has faded. However, the upside bias remains intact.
Silver daily chart
XAG/USD
| OVERVIEW | |
|---|---|
| Today last price | 30.45 |
| Today Daily Change | 0.45 |
| Today Daily Change % | 1.50 |
| Today daily open | 30 |
| TRENDS | |
|---|---|
| Daily SMA20 | 30.34 |
| Daily SMA50 | 28.47 |
| Daily SMA100 | 25.91 |
| Daily SMA200 | 24.57 |
| LEVELS | |
|---|---|
| Previous Daily High | 30.05 |
| Previous Daily Low | 29.39 |
| Previous Weekly High | 32.3 |
| Previous Weekly Low | 30.19 |
| Previous Monthly High | 32.51 |
| Previous Monthly Low | 26.02 |
| Daily Fibonacci 38.2% | 29.8 |
| Daily Fibonacci 61.8% | 29.64 |
| Daily Pivot Point S1 | 29.58 |
| Daily Pivot Point S2 | 29.16 |
| Daily Pivot Point S3 | 28.92 |
| Daily Pivot Point R1 | 30.24 |
| Daily Pivot Point R2 | 30.47 |
| Daily Pivot Point R3 | 30.9 |
More By This Author:
USD/CAD Advances Toward 1.3700 Ahead Of US Data, BoC Policy MeetingEUR/USD Sidelines Ahead Of ECB Policy Meeting
USD/CHF Seems Vulnerable Near 0.8900 Ahead Of US Services PMI
Disclaimer: Information on this article contains forward-looking statements that involve risks and uncertainties. Markets and instruments profiled on this page are for informational purposes ...
more


Time to shine!