
Silver Price Forecast: XAG/USD Continues To Soar Amid Perfect Storm Conditions

Image Source: Pixabay
XAG/USD hit another 13-year high to kick off the new trading week, testing above $36.80 per ounce and laying fresh tracks toward $37.00/oz as metals investors bank on a perfect storm of factors to continue pushing Silver prices into their highest bids since early 2012.
The US Dollar (USD) continues to get pummeled across the global FX market, with the US Dollar Index (DXY) stuck near multi-year lows. A weaker Greenback is helping to bolster spot Silver prices, with further support coming from ongoing market hopes for Federal Reserve (Fed) rate cuts sometime this year.
Markets hope for continued rebound in global Silver demand
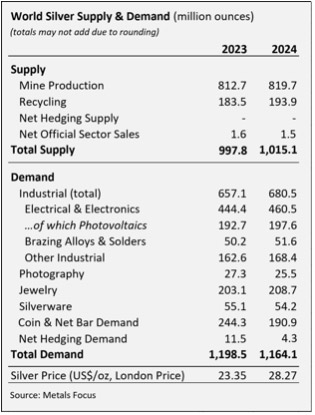
Industrial demand for Silver climbed through 2024, and investors are banking on a continued upswing in the Silver-hungry tech sector, specifically as green energies continue to eat up more Silver supply. However, overall global Silver demand fell through last year, but Silver bidders expect the upswing in overall Silver demand to continue.
This week’s upcoming US Consumer Price Index (CPI) inflation figures for May will be the next immediate roadblock for Silver bugs: a fresh spark in inflation data will push the Fed even further away from rate cuts that have already been pushed back to September. Ongoing trade talks between the US and China also represent a fly in the ointment. The Trump administration has a poor track record of keeping its cool when trying to come away from the Chinese negotiating table with a win, and global Silver usage relies heavily on burgeoning tech sectors on both sides of the Pacific.
Silver price forecast
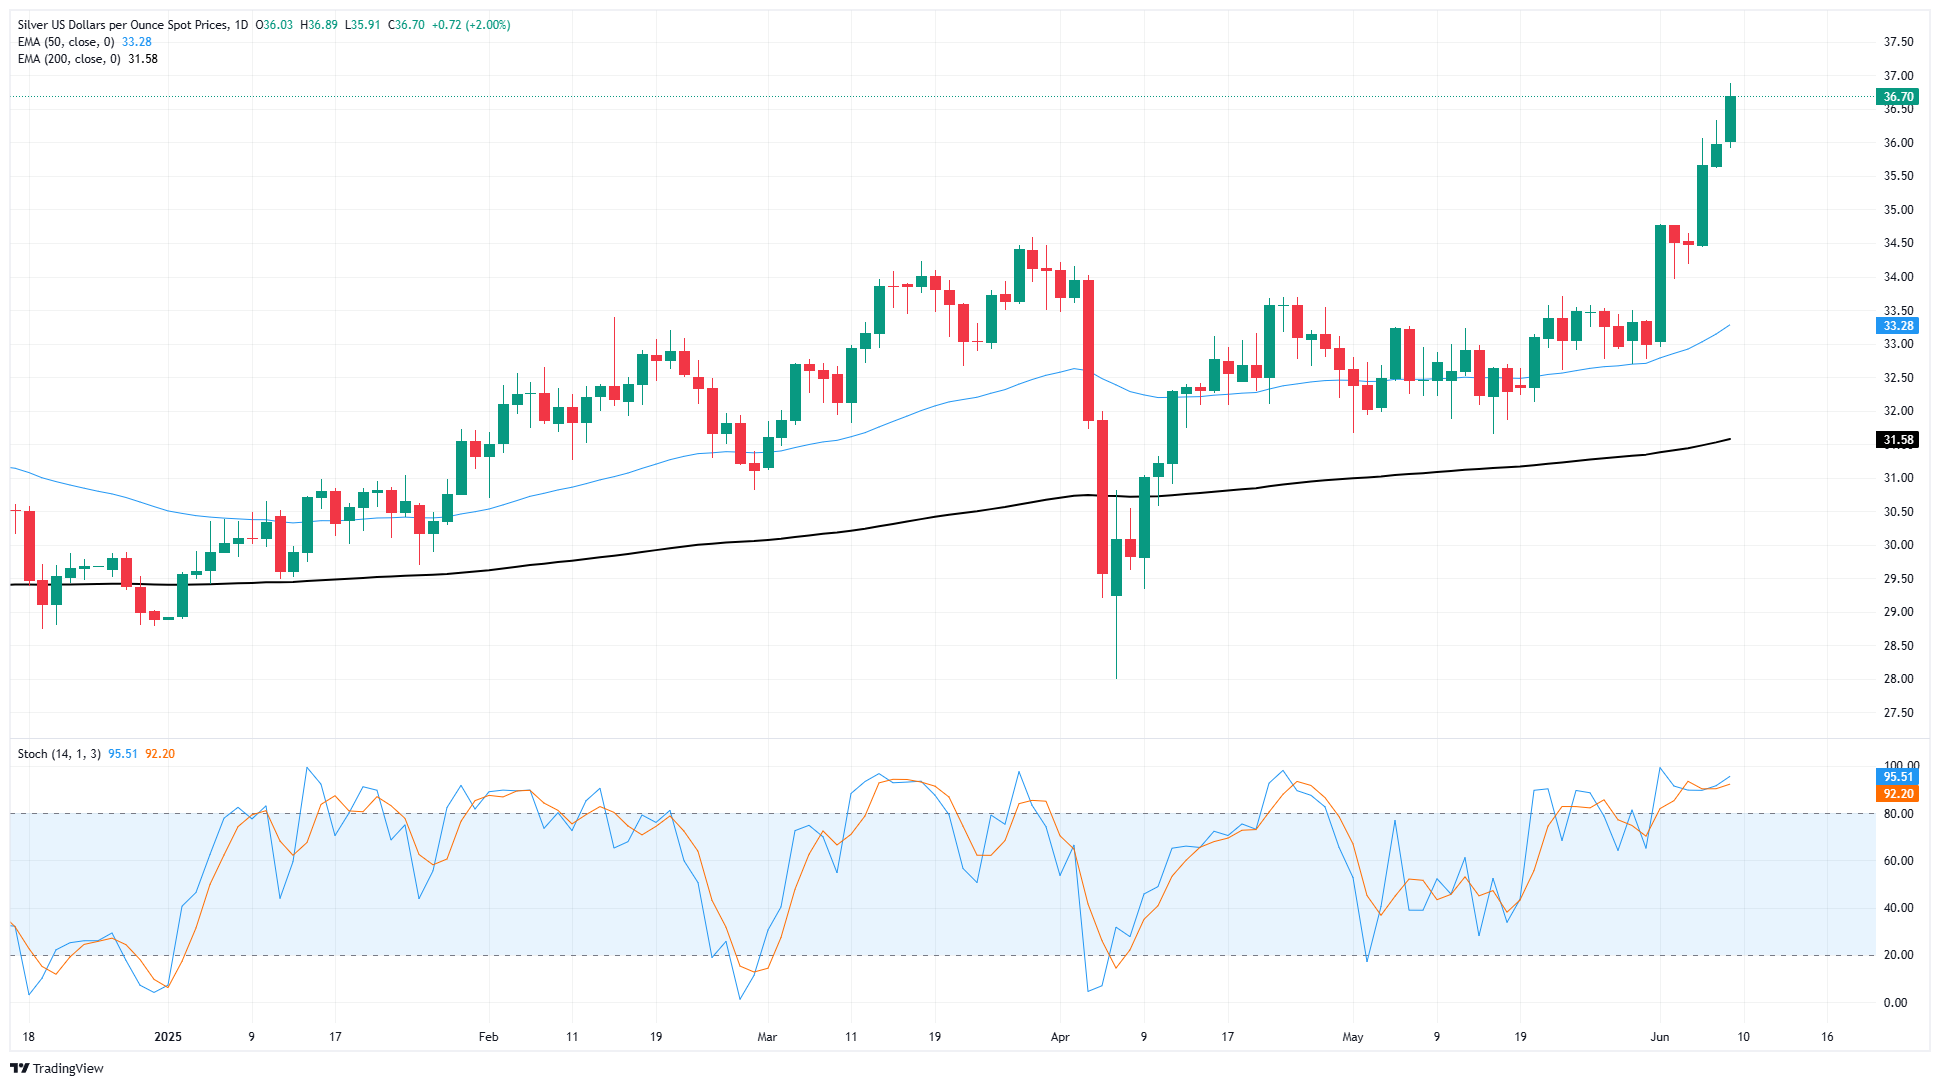
Silver punched in a stellar performance last week, gaining over 9% through last Friday and the white metal is already on pace to add further gains. Spot Silver prices are up nearly 32% bottom-to-top from April’s lows at the $28.00 handle, and it would take a 40% decline to push Silver bids back below the 200-day Exponential Moving Average (EMA) near $26.45/oz.
XAG/USD daily chart
(Click on image to enlarge)
More By This Author:
Canadian Dollar Gives Back Gains Despite Upbeat Jobs DataGBP/USD Continues To Find Fresh Highs As Greenback Withers
Canadian Dollar Continues To Gain Ground, But Momentum Is Fizzling


