

Image Source: Pixabay
Silver (XAG/USD) trades under pressure on Tuesday, retreating from recent highs as a modest rebound in the US Dollar (USD) and Treasury yields weighs on the metal. At the time of writing, spot prices are trading near $40.85, down over 1% on the day.
The white metal has been trapped in a tight band between $41.50 and $40.50 since last week, after hitting a fresh 14-year peak around $41.67 on Monday. While the pullback reflects profit-taking and short-term USD strength, the downside remains limited as markets are almost fully convinced that the Federal Reserve (Fed) will lower interest rates at its September 17 monetary policy meeting. Lower borrowing costs reduce the opportunity cost of holding non-yielding assets such as Silver, keeping the broader bullish tone intact.
The uptick in the Greenback comes despite the recent downward revision to US Nonfarm Payrolls (NFP), which confirmed that the labor market is losing momentum. Economists highlighted that the slowdown reflects businesses turning cautious, with some warning that the economy is edging closer to recessionary conditions. The US Dollar Index (DXY), which tracks the currency against a basket of six peers, is trading around 97.70 after staging a technical rebound from seven-week lows touched earlier in the day.
Attention now turns to this week's key inflation releases. The US Producer Price Index (PPI) will be published on Wednesday, followed by the Consumer Price Index (CPI) on Thursday, both of which are expected to shape expectations for the Fed’s policy outlook.
(Click on image to enlarge)
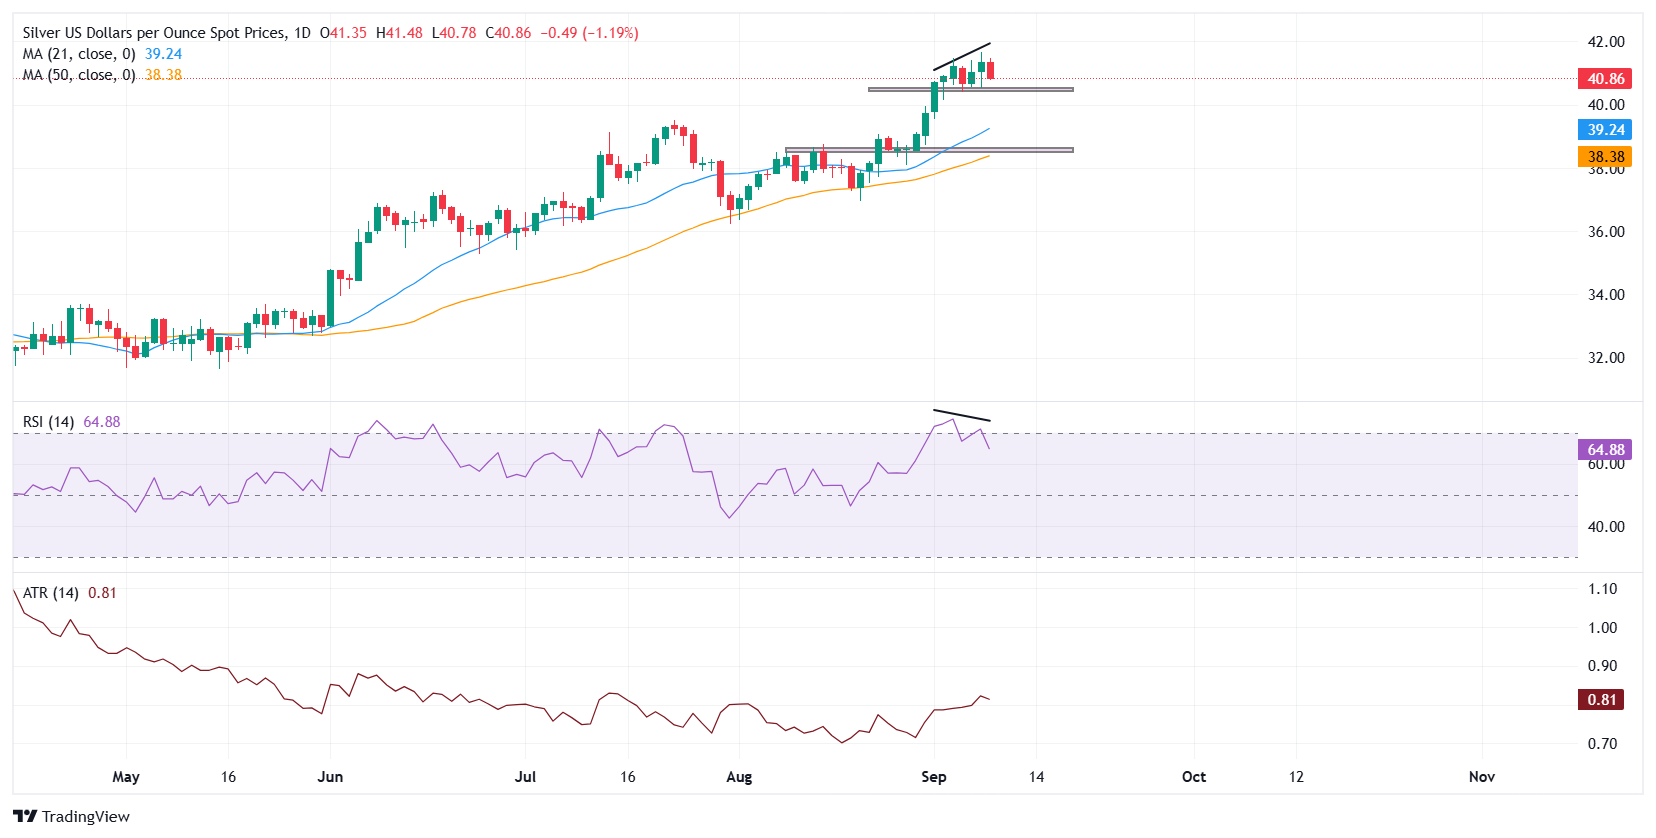
Technically, XAG/USD is struggling to extend its rally, with momentum indicators flashing caution. On the daily chart, the Relative Strength Index (RSI) is easing from overbought territory and showing bearish divergence, as price carved out higher highs while the oscillator printed lower highs. This divergence often precedes corrective pullbacks, highlighting fading upside momentum. The Average True Range (ATR) remains muted near 0.81, suggesting limited volatility in the short term, though a break outside the $41.50-$40.50 band could trigger a sharper move.
The first line of defense sits at $40.50, followed by the 21-day Simple Moving Average (SMA) at $39.24. Deeper losses could target the 50-day SMA near $38.40. On the upside, a sustained move above $41.70 would reduce the significance of the divergence and open the door toward the $42.00 psychological barrier.
More By This Author:
USD/JPY Reverses From Four-week Low As Us Jobs Revision Lifts GreenbackGold Retreats From Fresh Record Highs As US Dollar Firms After BLS Job Revision
EUR/USD Ticks Lower Ahead Of The US NFP Benchmark Revision


Comments
Log in or sign up to join the conversation.