
Silver Price Forecast: ETF Holdings Slip As XAGUSD Price Fades
Since silver’s recent price peak on September 4, the total known ETF holdings of the metal have fallen by roughly 18.3 million troy ounces. As a percentage of total holdings, the decline in ownership is nearly 3% compared to the corresponding -8% decline in silver’s price. As I have highlighted previously, robust demand via ETFs for gold and silver had helped to buoy the price of both precious metals. In recent months, modest drawbacks in price were met with relatively steadfast demand from exchange traded funds.
SILVER HOLDINGS SLIP ALONGSIDE PRICE
(Click on image to enlarge)
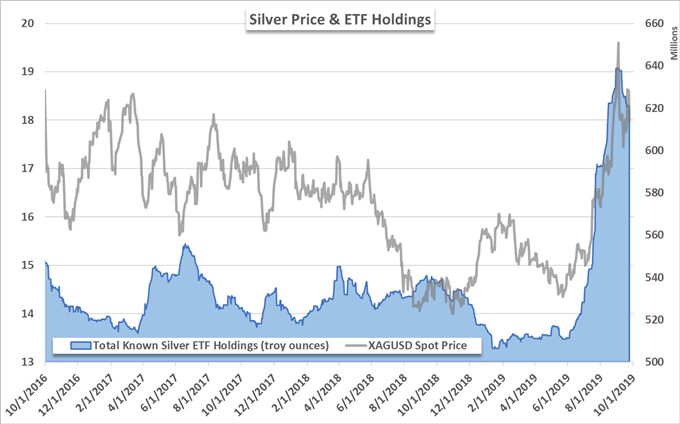
Data source: Bloomberg
Now, however, it seems as though some of the underlying demand for silver is waning as investors look to cast the precious metal aside. Perhaps due to shifting fundamental conditions or the nearly parabolic price climb in July and August, a continued decline in ETF holdings of silver could look to exacerbate the metal’s price decline. To that end, profit-taking due to the steep ascent in price could be a likely selling catalyst if the holdings of gold remain consistent.
GOLD HOLDINGS REMAIN ROBUST
(Click on image to enlarge)
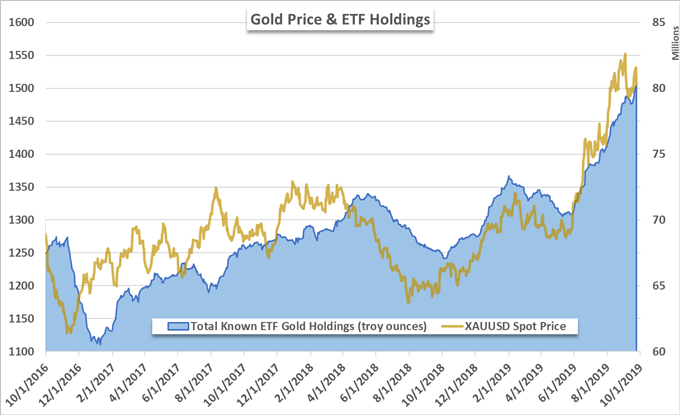
Data source: Bloomberg
Acting as a cheap alternative to gold, silver enjoys many of the same fundamental tailwinds as its more expensive counterpart. More specifically, gold and silver typically enjoy a boost when investors are looking to hedge against inflation or to safely park capital. Therefore, the relatively consistent holdings of gold – despite similar declines in price – could suggest the fundamental concerns that sparked the initial rotation into the precious metals remain.
Learn the Tips and Tricks of Trading the Gold-Silver Ratio
With that in mind, the recent decline in silver prices could look to continue as investors reassess the shorter-term outlook and take profit, but without a simultaneous decline in gold holdings, the longer-term picture may remain constructive for XAGUSD.
SILVER PRICE CHART (XAGUSD): DAILY TIME FRAME (OCTOBER 2015 – SEPTEMBER 2019)
(Click on image to enlarge)
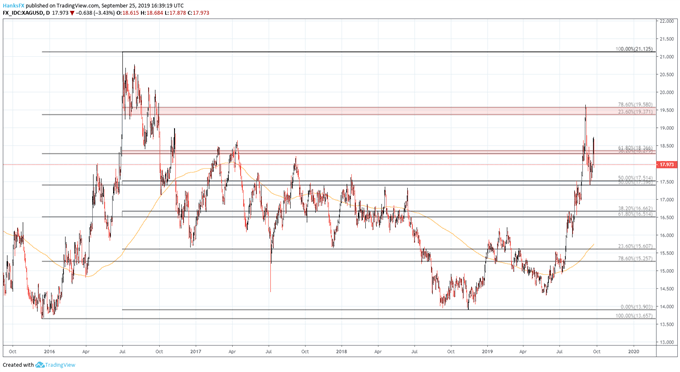
Created with TradingView
With that in mind, traders should look to technical levels for guidance as the longer- and shorter-term themes jockey for control over price. In the event of continued pressure, support could materialize around $17.5 – the midpoint of two Fibonacci sequences. Serious selling could see the metal look to subsequent support around $16.60 where two more Fibonacci levels reside.


