Silver Price Analysis: XAG/USD’s Uptrend Remains Intact, As Bullish Harami Looms

Image Source: Pixabay
- Silver stable at $26.64 after Fed holds rates steady, per Chair Powell's data-driven stance.
- Technicals: Silver rebounds from $26.27 low, eyes $27.00 resistance.
- Silver hints at bullish trend; breakout above $27.14 could reinforce this.
- Bearish shift requires silver below $26.13, targeting lower supports.
Silver's price stayed firm at around $26.64 after the Fed decided to hold rates unchanged and Powell’s press conference. Fed Chair Jerome Powell said they would remain data-dependent, decide meeting by meeting, and won’t cut rates until they’re confident that inflation is trending towards its 2% goal.
XAG/USD Price Analysis: Technical outlook
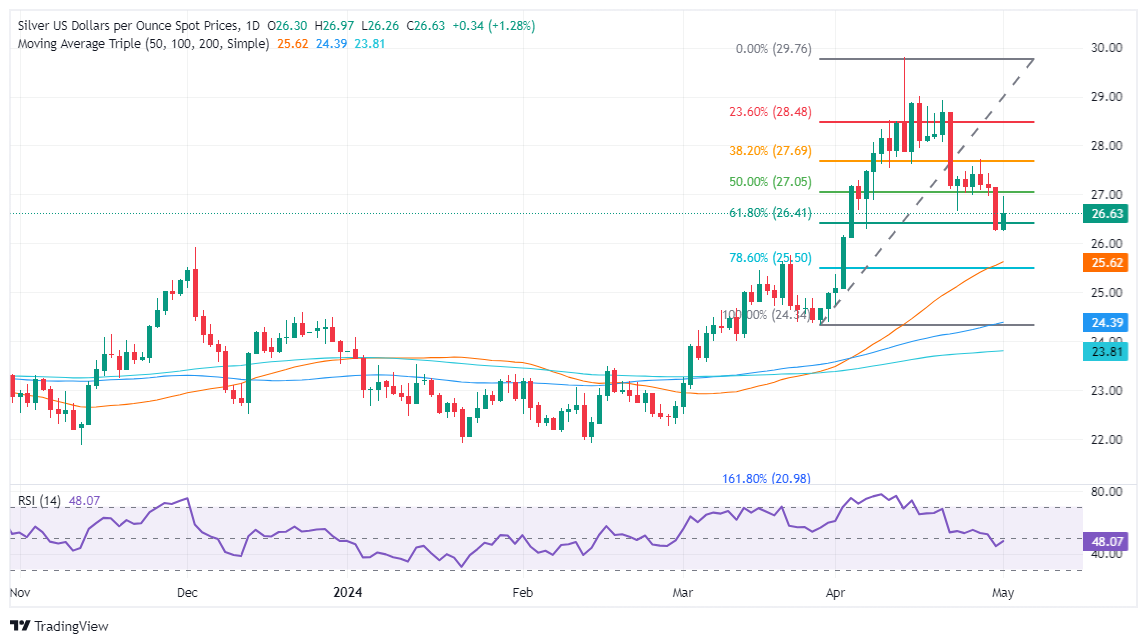
The grey metal dipped below the 61.8% Fibonacci retracement at $26.41, hitting a two-week low of $26.27 before resuming its uptrend. Although Silver reached a daily high of $26.96, buyers lacked the strength to break above the $27.00 figure, which paved the way to retreat to current price levels.
The XAG/USD is upward biased despite going through a pullback that sent prices from around $29.79 to $26.27. For sellers to shift the bias to bearish, they would need to push the spot price below the May 5 high at $26.13, which would pave the way toward $26.00 and below.
On the flip side, and the most likely scenario, if XAG/USD achieves a daily close at around the current level, a ‘bullish harami’ and a two-candle chart pattern will form. This usually would be bullish for the asset, but buyers must crack the April 30 high at $27.14, before resuming its uptrend.
XAG/USD Price Action – Daily Chart
XAG/USD
| OVERVIEW | |
|---|---|
| Today last price | 26.63 |
| Today Daily Change | 0.33 |
| Today Daily Change % | 1.25 |
| Today daily open | 26.3 |
| TRENDS | |
|---|---|
| Daily SMA20 | 27.68 |
| Daily SMA50 | 25.55 |
| Daily SMA100 | 24.35 |
| Daily SMA200 | 23.8 |
| LEVELS | |
|---|---|
| Previous Daily High | 27.14 |
| Previous Daily Low | 26.26 |
| Previous Weekly High | 28.69 |
| Previous Weekly Low | 26.67 |
| Previous Monthly High | 29.8 |
| Previous Monthly Low | 24.75 |
| Daily Fibonacci 38.2% | 26.59 |
| Daily Fibonacci 61.8% | 26.8 |
| Daily Pivot Point S1 | 25.99 |
| Daily Pivot Point S2 | 25.68 |
| Daily Pivot Point S3 | 25.1 |
| Daily Pivot Point R1 | 26.87 |
| Daily Pivot Point R2 | 27.45 |
| Daily Pivot Point R3 | 27.76 |
More By This Author:
GBP/USD Price Analysis: Wavers Below 1.2500 As Bearish Harami LoomsSilver Price Analysis: XAG/USD Plunges Over 3%, Back Beneath $27.00
Silver Price Analysis: XAG/USD Dips Slightly, Remains Bullish Above $27.00
Disclaimer: Information on these pages contains forward-looking statements that involve risks and uncertainties. Markets and instruments profiled on this page are for informational purposes only ...
more


