
Silver (XAG/USD) builds on the previous day's goodish rebound from the vicinity of mid-$22.00s, or a multi-day low and gains some follow-through traction on Thursday. The white metal maintains its bid tone through the early part of the European session and currently trades around the $23.00 round-figure mark, up over 0.20% for the day.
The post-FOMC US Dollar (USD) selling bias remains unabated, which, in turn, is seen as a key factor driving flows towards the USD-denominated commodities, including the XAG/USD. This, along with positive technical indicators on the daily chart, supports prospects for a further appreciating move. That said, the recent repeated failures near the $23.60-$23.70 supply zone, which constitute the formation of a bearish multiple tops pattern, warrants caution for bullish traders.
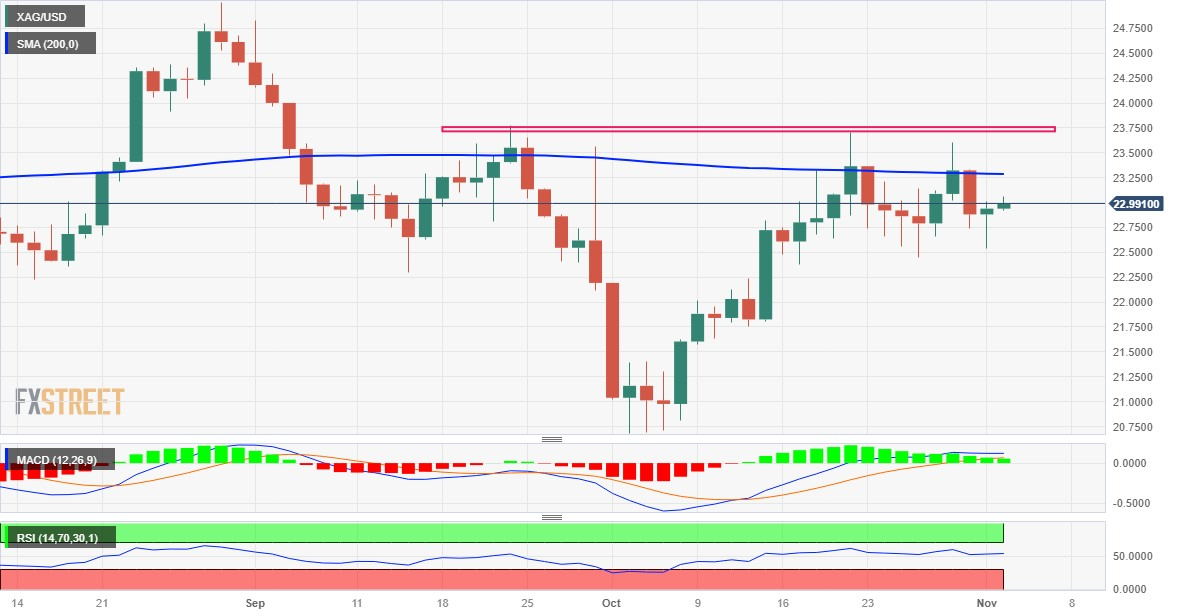
In the meantime, any subsequent move up is more likely to confront stiff resistance near the very important 200-day Simple Moving Average (SMA), currently pegged around the $23.30 region. Bulls, meanwhile, need to wait for a convincing breakout through the $23.60-$23.70 barrier, before placing fresh bets. The XAG/USD might then aim to surpass the $24.00 mark and test the $24.20 hurdle before making a fresh attempt towards conquering the $25.00 psychological mark.
On the flip side, the $22.50-$22.45 region now seems to have emerged as an immediate strong support. Some follow-through selling, however, will be seen as a fresh trigger for bearish traders and drag the XAG/USD to the $22.00 mark. The downward trajectory could get extended further towards the $21.70 horizontal support en route to the $21.35-$21.30 region and the $21.00 mark. Silver could eventually drop to the $20.70-$20.65 area, or a seven-month low touched in October.
Silver daily chart
(Click on image to enlarge)
Technical levels to watch
XAG/USD
| OVERVIEW | |
|---|---|
| Today last price | 23 |
| Today Daily Change | 0.06 |
| Today Daily Change % | 0.26 |
| Today daily open | 22.94 |
| TRENDS | |
|---|---|
| Daily SMA20 | 22.57 |
| Daily SMA50 | 22.93 |
| Daily SMA100 | 23.22 |
| Daily SMA200 | 23.29 |
| LEVELS | |
|---|---|
| Previous Daily High | 23.01 |
| Previous Daily Low | 22.54 |
| Previous Weekly High | 23.36 |
| Previous Weekly Low | 22.44 |
| Previous Monthly High | 23.7 |
| Previous Monthly Low | 20.68 |
| Daily Fibonacci 38.2% | 22.83 |
| Daily Fibonacci 61.8% | 22.72 |
| Daily Pivot Point S1 | 22.65 |
| Daily Pivot Point S2 | 22.36 |
| Daily Pivot Point S3 | 22.18 |
| Daily Pivot Point R1 | 23.12 |
| Daily Pivot Point R2 | 23.3 |
| Daily Pivot Point R3 | 23.59 |
More By This Author:
USD/JPY Corrects Further From YTD Top, Slides To 150.00 Neighbourhood Amid USD Selling BiasGold Price Forecast: XAU/USD Stages A Modest Recovery Above $1,980 After Fed Rate Pause
EUR/USD Price Analysis: Hovers Above The 1.0550 Key Level Ahead Of Fed Decision


Comments
Log in or sign up to join the conversation.