Silver Price Analysis: XAG/USD Stands Neutral Following ISM PMIs, Labor Data Looms

Image Source: Pixabay
The XAG/USD pair is trading near the $24.98 level, mostly neutral during Monday's session. This comes after the signals of resilience in the US economy underscored by the recent Institute for Supply Management (ISM) report and the surprising uptick in the Manufacturing Purchasing Managers' Index (PMI). In that sense, the resilience of the US economy fueled a rise in hawkish bets on the Federal Reserve (Fed) in hand with higher US Treasury yields which made the grey metal decline.
The recent figures from the Institute for Supply Management (ISM) report have brought a breath of fresh air to perceptions of the US economy, revealing an uptick in business activity for March. This comes as a signal of economic robustness, a sentiment echoed by the Manufacturing Purchasing Managers' Index (PMI) which climbed to 50.3 in March. This figure not only surpassed the forecasted 48.4 but marked a noticeable advance from February's 47.8. Meanwhile, the ISM report's Prices Paid Index leaped to an annual high of 55.8, a level not seen since it stood at 52.5 in August 2022.
This pattern of improvement might lead the Federal Reserve (Fed) to think twice about easing its monetary policy. Market reactions were swift, with the likelihood of a rate cut at the Fed's June meeting plummeting from 85% to around 65% in response to the enduring resilience of the US economy. The bond market has also felt the ripples of these developments, with a notable surge in US Treasury bond yields, often seen as the cost of holding non-yielding metals, with the 2-year yield rising to 4.71%, while both the 5-year and the 10-year yields are at 4.33%, all pointing to a sharp uptick and possibly reflecting increased hawkish bets on the Fed.
Looking ahead, key US labor market indicators such as Nonfarm Payrolls, Average Hourly Earnings, and the Unemployment Rate are highly anticipated. These figures are poised to provide deeper insights into the current health and trajectory of the country's workforce, offering critical clues to both policymakers and investors.
XAG/USD technical analysis
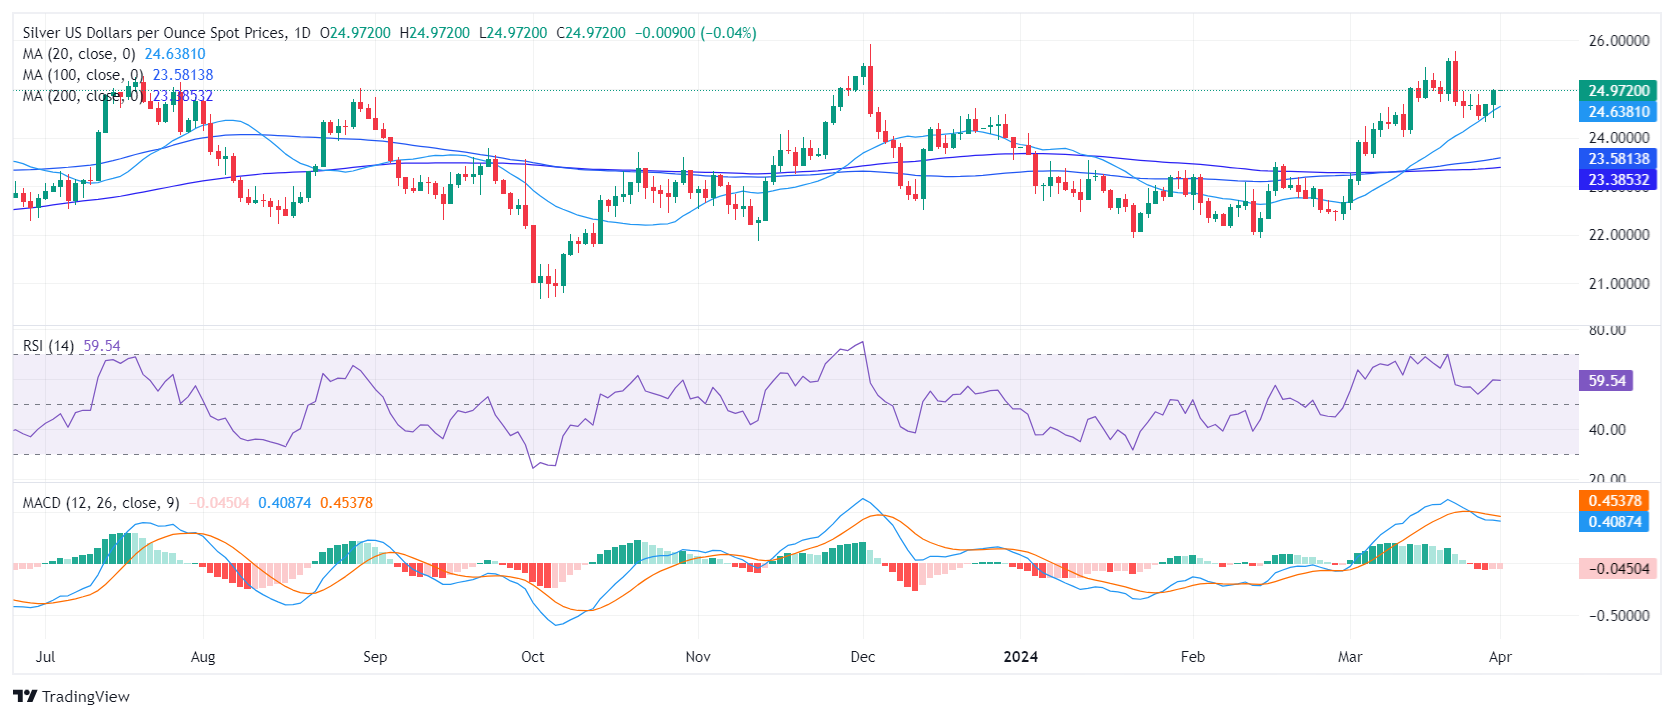
On the daily chart, the Relative Strength Index (RSI) reveals a positive trend for the XAG/USD. The RSI reading, nestled in the positive territory, remains steady affirming the dominance of buyers, which may lead to continued upward momentum. However, the Moving Average Convergence Divergence (MACD) stands in negative territory, printing red bars which suggests that there is a mild bearish presence.
When scrutinizing the overall trend, the XAG/USD currently sits above the 20-day, 100-day, and 200-day Simple Moving Averages (SMA), denoting strong upward momentum over the larger time frames.
(Click on image to enlarge)

XAG/USD
| OVERVIEW | |
|---|---|
| Today last price | 24.99 |
| Today Daily Change | 0.01 |
| Today Daily Change % | 0.04 |
| Today daily open | 24.98 |
| TRENDS | |
|---|---|
| Daily SMA20 | 24.55 |
| Daily SMA50 | 23.44 |
| Daily SMA100 | 23.55 |
| Daily SMA200 | 23.37 |
| LEVELS | |
|---|---|
| Previous Daily High | 25 |
| Previous Daily Low | 24.39 |
| Previous Weekly High | 25 |
| Previous Weekly Low | 24.33 |
| Previous Monthly High | 25.77 |
| Previous Monthly Low | 22.51 |
| Daily Fibonacci 38.2% | 24.77 |
| Daily Fibonacci 61.8% | 24.63 |
| Daily Pivot Point S1 | 24.58 |
| Daily Pivot Point S2 | 24.18 |
| Daily Pivot Point S3 | 23.97 |
| Daily Pivot Point R1 | 25.19 |
| Daily Pivot Point R2 | 25.4 |
| Daily Pivot Point R3 | 25.8 |
More By This Author:
EUR/JPY Price Analysis: Bears Showed Signs Of Presence, Long-Term Bullish Stronghold Remained Unchallenged
EUR/GBP Price Analysis: Bearish Sentiment Prevails, Daily And Hourly Trends Lean Negative
Canadian Dollar Rallies On Upbeat GDP Data And A Softer USD
Information on these pages contains forward-looking statements that involve risks and uncertainties. Markets and instruments profiled on this page are for informational purposes only and should not ...
more


