
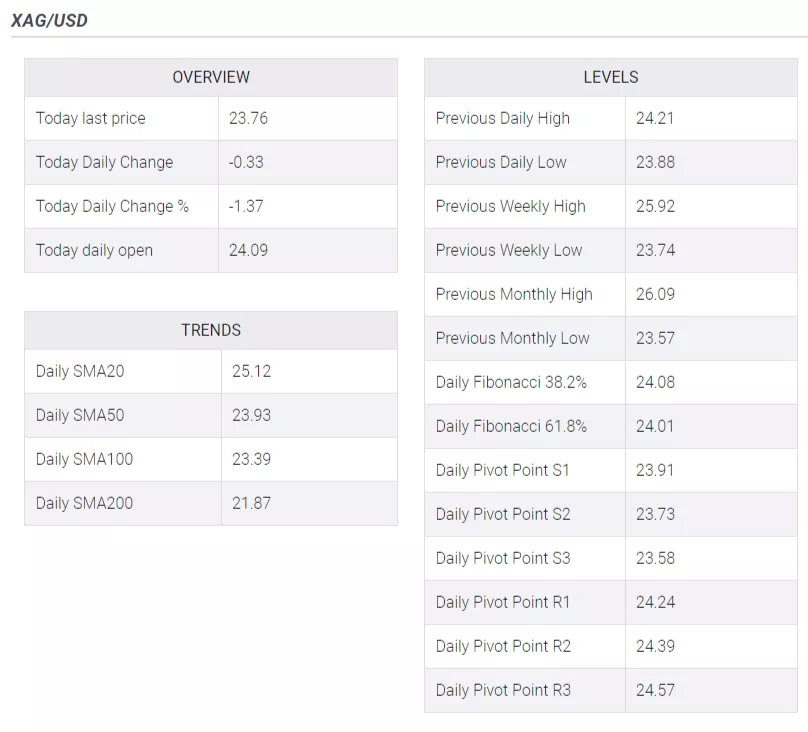
Silver price continues to validate a double-top formation, falls to fresh six-week lows around $23.64, shy of testing the 100-day Exponential Moving Average (EMA) at $23.48. Factors like US Retails Sales improving in April spurred a jump in US Treasury bond yields, a headwind for the white metal. Therefore, the XAG/USD is trading at $23.73 after reaching a daily high of $24.10.
XAG/USD Price Analysis: Technical outlook
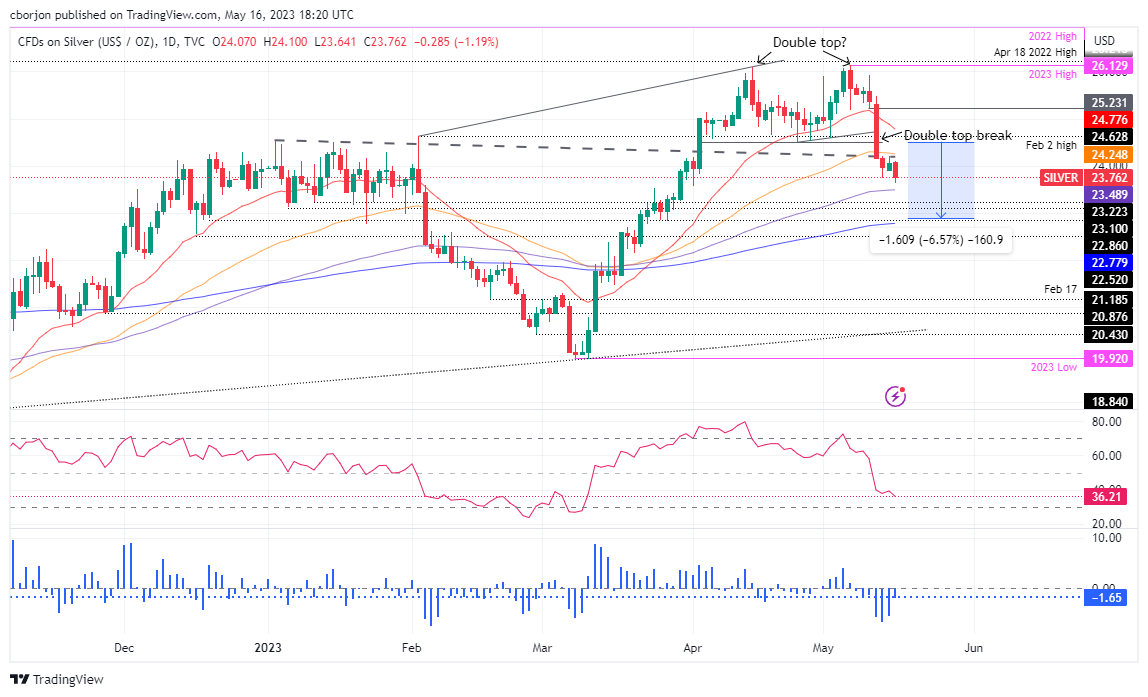
A double-top chart pattern remains as the XAG/USD continued to slide, sitting between the 50 and 100-day EMAs, each at $24.24 and $23.48, respectively. The Relative Strength Index (RSI) indicator at bearish territory suggests Silver’s fall could continue in the near term, but the 3-day Rate of Change (RoC) has begun to show that sellers are losing momentum.
If XAG/USD cracks the 100-day EMA, that will exacerbate a fall toward the $23.00 a troy ounce figure before sellers can reach the double-top’s objective to fall toward $22.90, shy of testing the 200-day EMA at $22.77.
On the other hand, if XAG/USD reclaims the $24.00 figure, that could exert upward pressure on the XAG/USD and open the door to test the 50-day EMA. A breach of the latter will expose the February 2 high at $24.63 before challenging the $25.00 psychological figure.
XAG/USD Price Action – Daily chart
(Click on image to enlarge)
More By This Author:
Fed's Mester: I Don't Think We're At That Hold Rate Yet
People's Bank Of China: Will Keep Interest Rates Reasonable And Appropriate
USD/JPY Eases From Over A One-week High, Slides Below 136.00 Amid Softer USD


Comments
Log in or sign up to join the conversation.