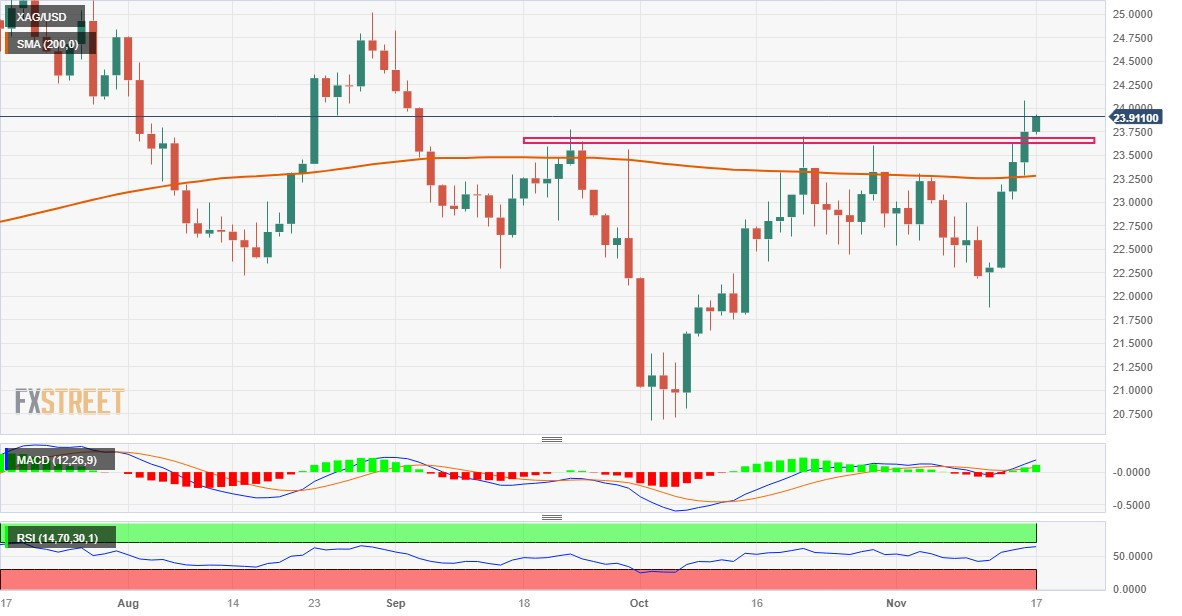
Silver Price Analysis: XAG/USD Sits Near 10-Week Peak, Bulls Await A Move Beyond $24.00
Silver (XAG/USD) gains positive traction for the fifth successive day on Friday and remains well within the striking distance of its highest level since September 4 touched the previous day. The white metal currently trades just below the $24.00 mark and seems poised to build on this week's solid bounce from a four-week trough.
From a technical perspective, acceptance above the very important 200-day Simple Moving Average (SMA) and the overnight breakout through the $23.60-$23.70 supply zone was seen as a fresh trigger for bullish traders. Moreover, oscillators on the daily chart have been gaining positive traction and validate the near-term positive outlook, suggesting that the path of least resistance for the XAG/USD is to the upside.
Some follow-through buying beyond the $24.00 round figure will reaffirm the constructive setup and the white metal to the $24.20-$24.25 intermediate resistance. The momentum could get extended and allow the XAG/USD to make a fresh attempt towards conquering the $25.00 psychological mark. Nevertheless, Silver remains on track to register strong weekly gains and post its highest weekly close since late August.
On the flip side, the $23.70-$23.60 strong resistance breakpoint now seems to protect the immediate downside ahead of the 200-day SMA, currently pegged near the $23.30 region. Any further decline might now attract fresh buyers and remain limited near the $23.00 mark. The latter should act as a key pivotal point, which if broken could drag the XAG/USD to the $22.35-$22.30 zone en route to the $22.00 mark.
A convincing break below the latter might shift the near-term bias back in favour of bearish traders. Some follow-through selling below the $21.85 region, or the monthly low, could make the XAG/USD vulnerable to accelerate the fall towards the $21.35-$21.30 region. The white metal could eventually weaken further below the $21.00 mark and test a multi-month low, around the $20.70-$20.65 area touched in October.
Silver daily chart
(Click on image to enlarge)
Technical levels to watch
XAG/USD
| OVERVIEW | |
|---|---|
| Today last price | 23.9 |
| Today Daily Change | 0.15 |
| Today Daily Change % | 0.63 |
| Today daily open | 23.75 |
| TRENDS | |
|---|---|
| Daily SMA20 | 22.94 |
| Daily SMA50 | 22.68 |
| Daily SMA100 | 23.21 |
| Daily SMA200 | 23.27 |
| LEVELS | |
|---|---|
| Previous Daily High | 24.08 |
| Previous Daily Low | 23.28 |
| Previous Weekly High | 23.26 |
| Previous Weekly Low | 22.19 |
| Previous Monthly High | 23.7 |
| Previous Monthly Low | 20.68 |
| Daily Fibonacci 38.2% | 23.78 |
| Daily Fibonacci 61.8% | 23.59 |
| Daily Pivot Point S1 | 23.33 |
| Daily Pivot Point S2 | 22.91 |
| Daily Pivot Point S3 | 22.53 |
| Daily Pivot Point R1 | 24.13 |
| Daily Pivot Point R2 | 24.5 |
| Daily Pivot Point R3 | 24.92 |
More By This Author:
USD/CHF Consolidates Near 0.8880 Ahead Of Swiss Industrial ProductionAUD/USD Holds Above The Mid-0.6400s, Eyes On The US Housing Data
USD/JPY Falls Back Towards 150.50, Pares Away Mid-Week Gains
Disclosure: Information on this article contains forward-looking statements that involve risks and uncertainties. Markets and instruments profiled on this page are for informational purposes ...
more


