Silver Price Analysis: XAG/USD Seems Poised To Retest Sub-$20.00 Levels
- Silver comes under some renewed selling pressure on Wednesday, albeit lacks follow-through.
- The oversold RSI on the daily chart holds back bears from placing fresh bets around the XAG/USD.
- The technical setup supports prospects for an extension of the recent sharp depreciating move.
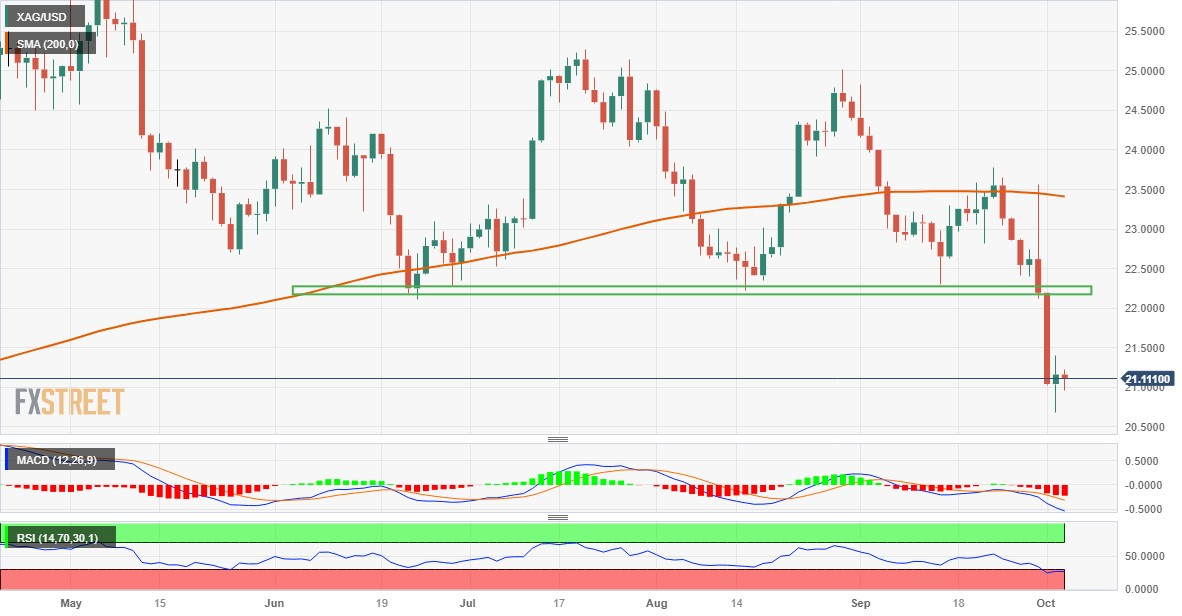
Silver struggles to capitalize on the previous day's recovery move from the $20.70-$20.65 area, or its lowest level since March 13, and meets with a fresh supply on Wednesday. The white metal, however, rebounds from the daily trough touched during the early European session and currently trades around the $21.10 region, down less than 0.15% for the day.
From a technical perspective, the recent breakdown through the $23.30-$23.20 horizontal support was seen as a fresh trigger for bearish traders. That said, the Relative Strength Index (RSI) on the daily chart is flashing oversold conditions. This, in turn, warrants caution and makes it prudent to wait for some near-term consolidation or a modest bounce before positioning for any further depreciating move.
Nevertheless, the XAG/USD remains vulnerable to prolong its descending trend and slide back to the $20.70-$20.65 zone, or a nearly seven-month low touched on Tuesday. The downward trajectory could get extended further towards challenging the YTD trough – levels just below the $20.00 psychological mark set in March.
On the flip side, a strength beyond the overnight swing high, around the $21.40 region, might trigger a short-covering rally and allow the XAG/USD to reclaim the $22.00 round-figure mark. Any subsequent move up might be seen as a selling opportunity and remain capped near the $22.20-$22.30 strong horizontal support breakpoint. The latter should act as a pivotal point, which if cleared might shift the bias in favor of bullish traders.
Silver daily chart
(Click on image to enlarge)
Technical levels to watch
XAG/USD
| OVERVIEW | |
|---|---|
| Today last price | 21.14 |
| Today Daily Change | -0.02 |
| Today Daily Change % | -0.09 |
| Today daily open | 21.16 |
| TRENDS | |
|---|---|
| Daily SMA20 | 22.8 |
| Daily SMA50 | 23.31 |
| Daily SMA100 | 23.46 |
| Daily SMA200 | 23.43 |
| LEVELS | |
|---|---|
| Previous Daily High | 21.39 |
| Previous Daily Low | 20.68 |
| Previous Weekly High | 23.65 |
| Previous Weekly Low | 22.12 |
| Previous Monthly High | 24.82 |
| Previous Monthly Low | 22.12 |
| Daily Fibonacci 38.2% | 21.12 |
| Daily Fibonacci 61.8% | 20.96 |
| Daily Pivot Point S1 | 20.76 |
| Daily Pivot Point S2 | 20.37 |
| Daily Pivot Point S3 | 20.06 |
| Daily Pivot Point R1 | 21.47 |
| Daily Pivot Point R2 | 21.79 |
| Daily Pivot Point R3 | 22.18 |
More By This Author:
Crude Oil Futures: Further Recovery Looks LikelyEUR/USD Price Analysis: Extends Its Downside Above 1.0450, Eyes On Eurozone Data, ECB’s Lagarde Speech
GBP/USD Consolidates Below 1.2100 Mark, Seems Vulnerable Near Multi-Month Low
Disclaimer: Information on these pages contains forward-looking statements that involve risks and uncertainties. Markets and instruments profiled on this page are for informational purposes only ...
more


