Silver Price Analysis: XAG/USD Flirts With YTD Peak, Bulls Await Move Beyond $24.00 Mark
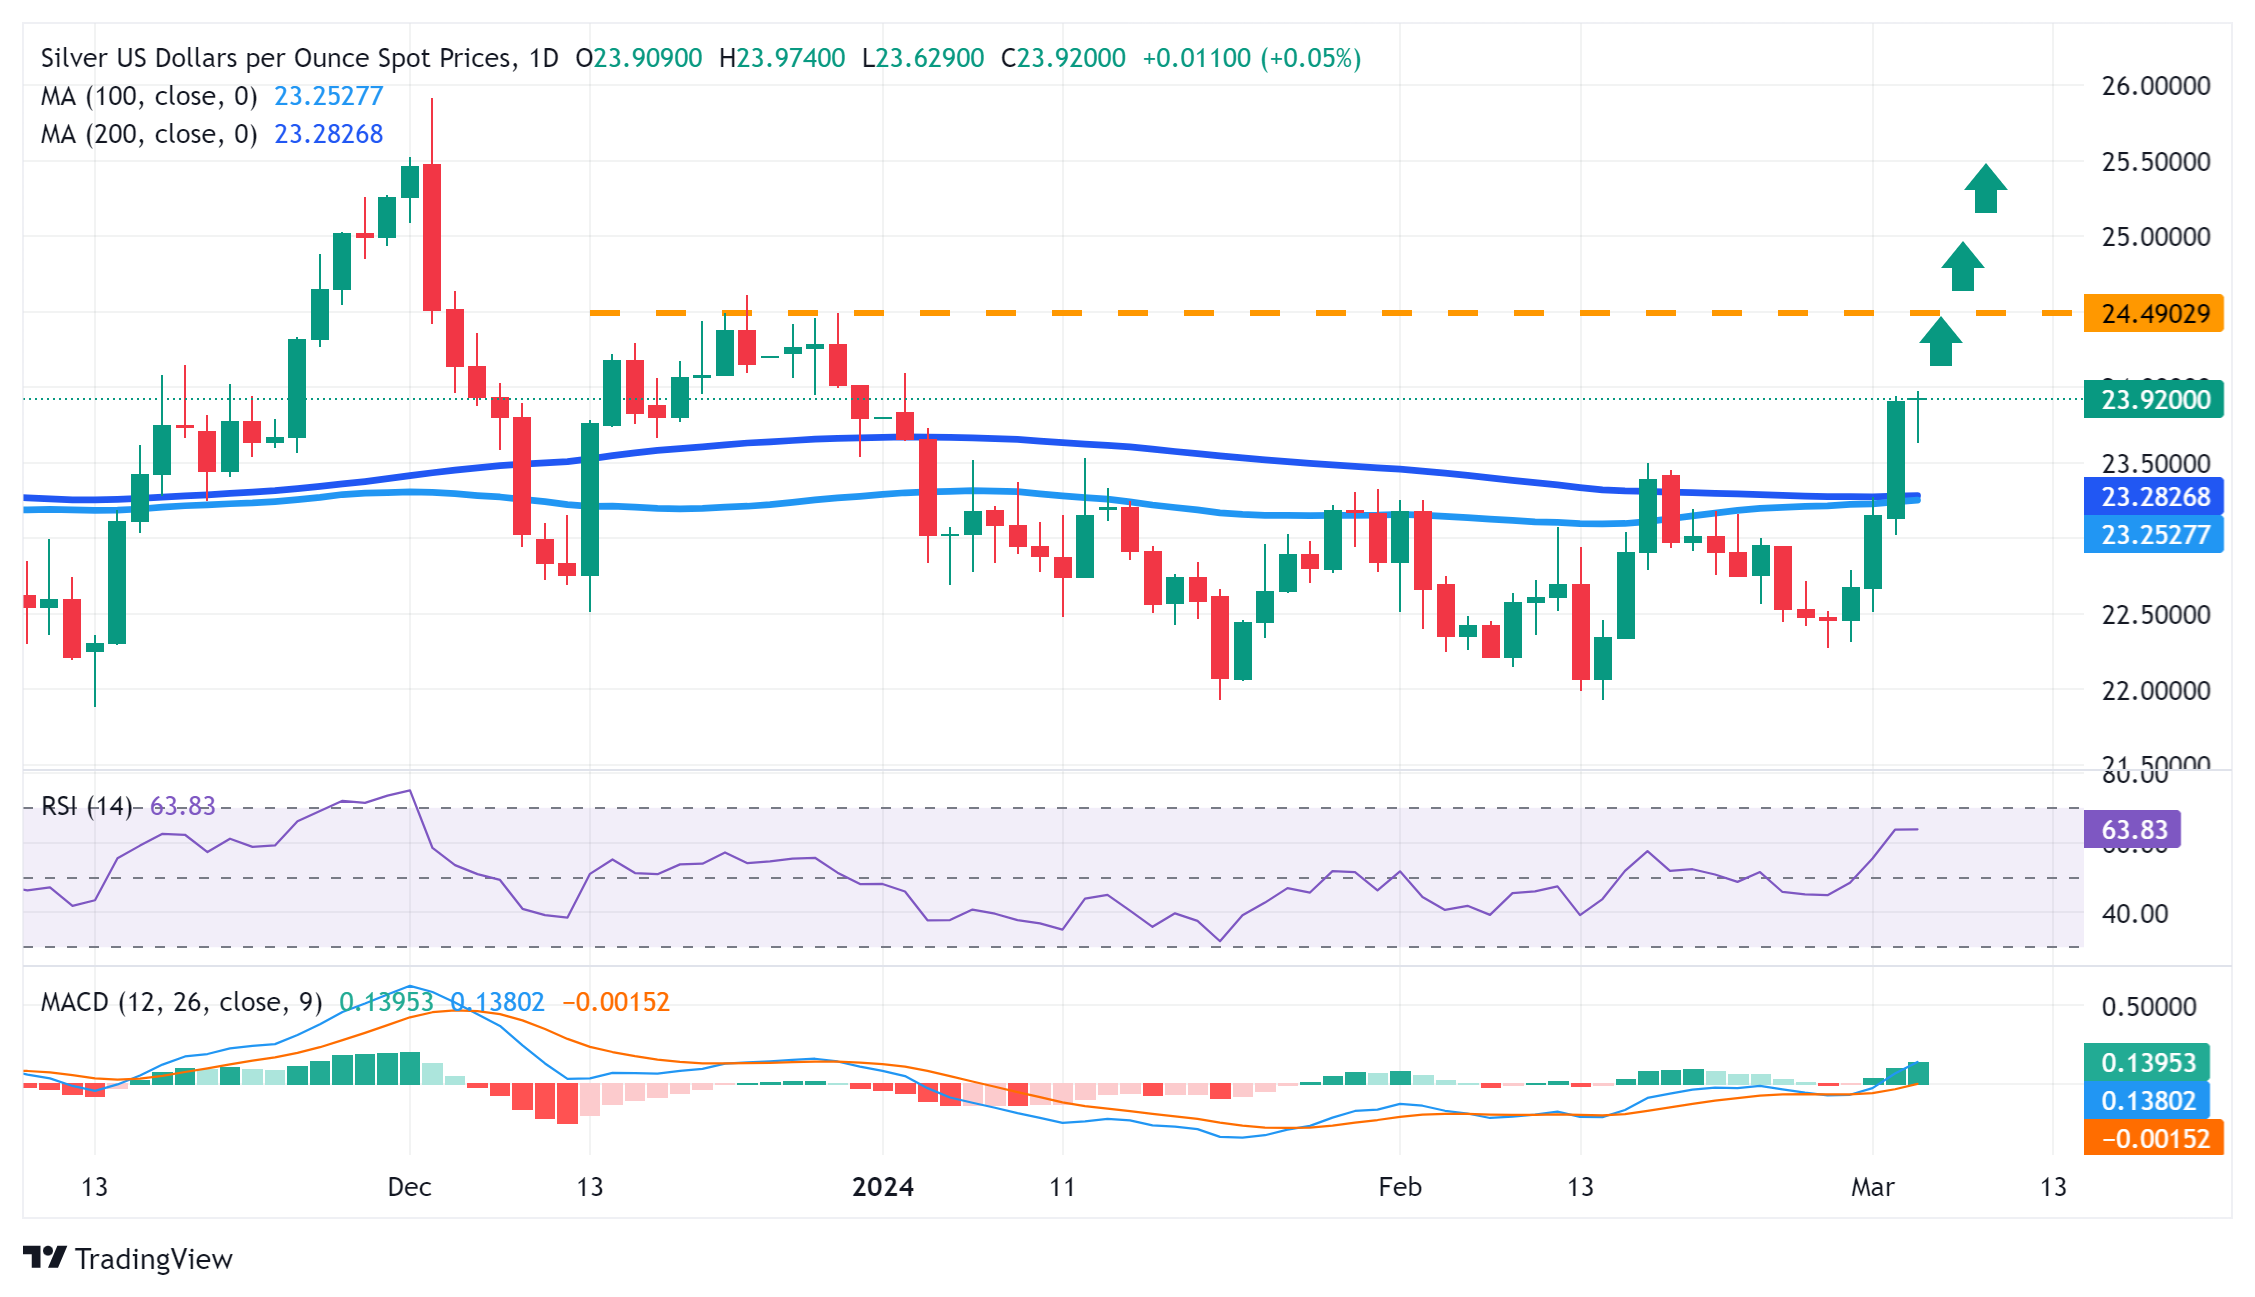
Silver (XAG/USD) attracts some dip-buying near the $23.65-$23.60 region on Tuesday and flirts with the YTD peak during the first half of the European session. The white metal currently trades just below the $24.00 mark and looks to build on the previous day's breakout momentum through the $23.30-$23.35 confluence hurdle.
The latter comprises the 100- and the 200-day Simple Moving Averages (SMA), which should now act as a key pivotal point for the XAG/USD. Any meaningful corrective slide is more likely to get bought into near the said resistance-turned-support and remain limited near the $23.00 round figure. That said, some follow-through selling will suggest that a one-week-old strong rally has run out of steam and pave the way for deeper losses.
The XAG/USD might then accelerate the slide towards the $22.50-$22.45 intermediate support before eventually dropping to sub-$22.00 levels or the two-month trough touched in January and retested in February. The downward trajectory could extend further and drag the white metal further towards the next relevant support near the $21.40-$21.35 region. That said, positive oscillators on the daily chart warrant caution for bearish traders.
On the flip side, momentum beyond the $24.00 mark is likely to confront some resistance near the $24.30-$24.35 region ahead of the $24.50 supply zone. A sustained strength beyond should allow the XAG/USD to reclaim the $25.00 psychological mark and climb further towards the $25.45-$25.50 intermediate hurdle en route to the $26.00 neighbourhood, or the December 2023 swing high.
Silver daily chart
(Click on image to enlarge)
XAG/USD
| OVERVIEW | |
|---|---|
| Today last price | 23.94 |
| Today Daily Change | 0.03 |
| Today Daily Change % | 0.13 |
| Today daily open | 23.91 |
| TRENDS | |
|---|---|
| Daily SMA20 | 22.75 |
| Daily SMA50 | 22.94 |
| Daily SMA100 | 23.24 |
| Daily SMA200 | 23.28 |
| LEVELS | |
|---|---|
| Previous Daily High | 23.94 |
| Previous Daily Low | 23.02 |
| Previous Weekly High | 23.27 |
| Previous Weekly Low | 22.28 |
| Previous Monthly High | 23.5 |
| Previous Monthly Low | 21.93 |
| Daily Fibonacci 38.2% | 23.59 |
| Daily Fibonacci 61.8% | 23.38 |
| Daily Pivot Point S1 | 23.31 |
| Daily Pivot Point S2 | 22.7 |
| Daily Pivot Point S3 | 22.38 |
| Daily Pivot Point R1 | 24.23 |
| Daily Pivot Point R2 | 24.55 |
| Daily Pivot Point R3 | 25.15 |
More By This Author:
AUD/JPY Price Analysis: Bullish Sentiment Persists, Indicators Point To Weak MomentumEUR/GBP Stands Flat After European Inflation Figures From February
GBP/JPY Bounces Off One-Week Low, Still Deep In The Red Below 190.00 Mark


