Silver Price Analysis: XAG/USD Flirts With 200-Day SMA Hurdle Near $23.20-25 Region
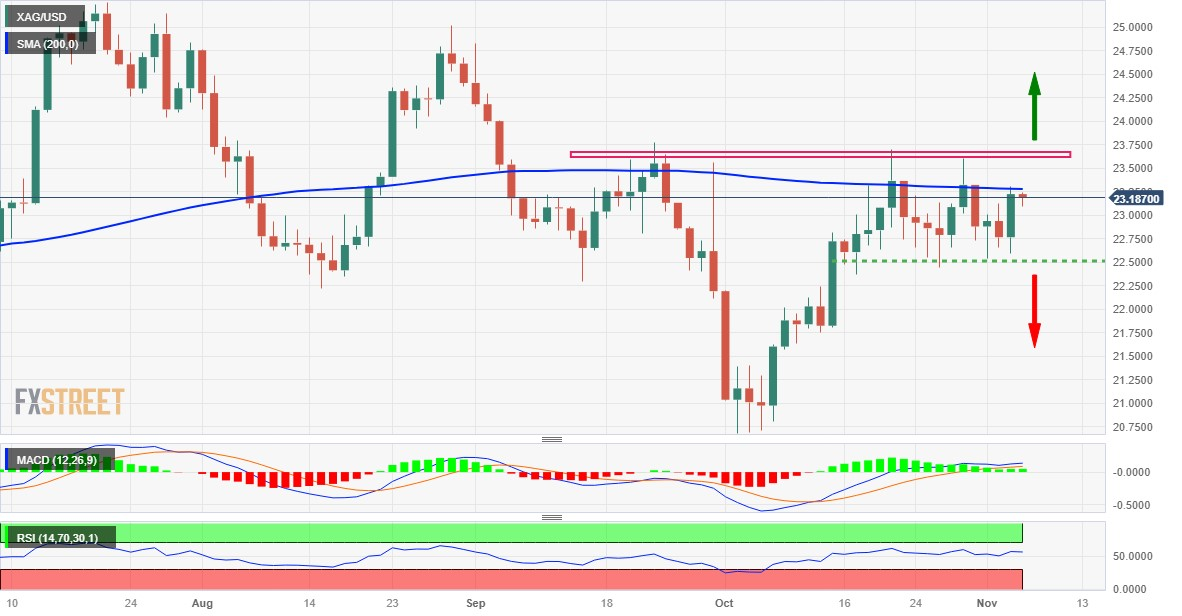
Silver (XAG/USD) reverses an intraday dip to the $23.10 area and climbs to the top end of its daily trading range during the first half of the European session on Monday. Bulls still await a sustained strength beyond the very important 200-day Simple Moving Average (SMA) before placing fresh bets.
Any subsequent move up, however, is more likely to confront stiff resistance near the $23.60-$23.70 supply zone, which should act as a key pivotal point. With oscillators on the daily chart holding in the positive territory, a sustained strength beyond will be seen as a fresh trigger for bullish traders and pave the way for some meaningful upside.
The XAG/USD might then aim to surpass the $24.00 mark and test the next relevant hurdle near the $24.20-$24.25 zone. The momentum could get extended further and allow bulls to make a fresh attempt to conquer the $25.00 psychological mark before the white metal eventually climbs to the July swing high, around the $25.20-$25.25 zone.
On the flip side, any meaningful slide below the $23.00 mark is more likely to find decent support and remain limited near the $22.60-$22.50 horizontal support. A convincing break below the latter will shift the bias back in favour of bearish traders and drag the XAG/USD to the $22.00 mark en route to the $21.70 horizontal support zone.
Some follow-through selling will expose the $21.35-$21.30 support, below which the XAG/USD seems all set to accelerate the fall further below the $21.00 mark, towards the $20.70-$20.65 area, or a seven-month low touched in October.
Silver daily chart
(Click on image to enlarge)
Technical levels to watch
XAG/USD
| OVERVIEW | |
|---|---|
| Today last price | 23.18 |
| Today Daily Change | -0.04 |
| Today Daily Change % | -0.17 |
| Today daily open | 23.22 |
| TRENDS | |
|---|---|
| Daily SMA20 | 22.74 |
| Daily SMA50 | 22.88 |
| Daily SMA100 | 23.2 |
| Daily SMA200 | 23.28 |
| LEVELS | |
|---|---|
| Previous Daily High | 23.3 |
| Previous Daily Low | 22.59 |
| Previous Weekly High | 23.61 |
| Previous Weekly Low | 22.54 |
| Previous Monthly High | 23.7 |
| Previous Monthly Low | 20.68 |
| Daily Fibonacci 38.2% | 23.03 |
| Daily Fibonacci 61.8% | 22.86 |
| Daily Pivot Point S1 | 22.78 |
| Daily Pivot Point S2 | 22.33 |
| Daily Pivot Point S3 | 22.06 |
| Daily Pivot Point R1 | 23.49 |
| Daily Pivot Point R2 | 23.75 |
| Daily Pivot Point R3 | 24.2 |
More By This Author:
S&P 500 Rallies As Markets Digest Soft Us Jobs Data, Fed Rate Hike PauseDollar Is Vulnerable After Worst Week In Months
NIO Stock Forecast: NIO Gains Despite Announcing 10% Cut To Workforce
Disclosure: Information on this article contains forward-looking statements that involve risks and uncertainties. Markets and instruments profiled on this page are for informational purposes ...
more


