Silver Price Analysis: XAG/USD Defends 100-Hour SMA, Trades With Modest Gains Below $23.00

Image Source: Pixabay
- Silver regains positive traction on Thursday, albeit lacks follow-through buying.
- The mixed technical setup warrants caution before placing any directional bets.
- A sustained strength beyond $23.00 should pave the way for additional gains.
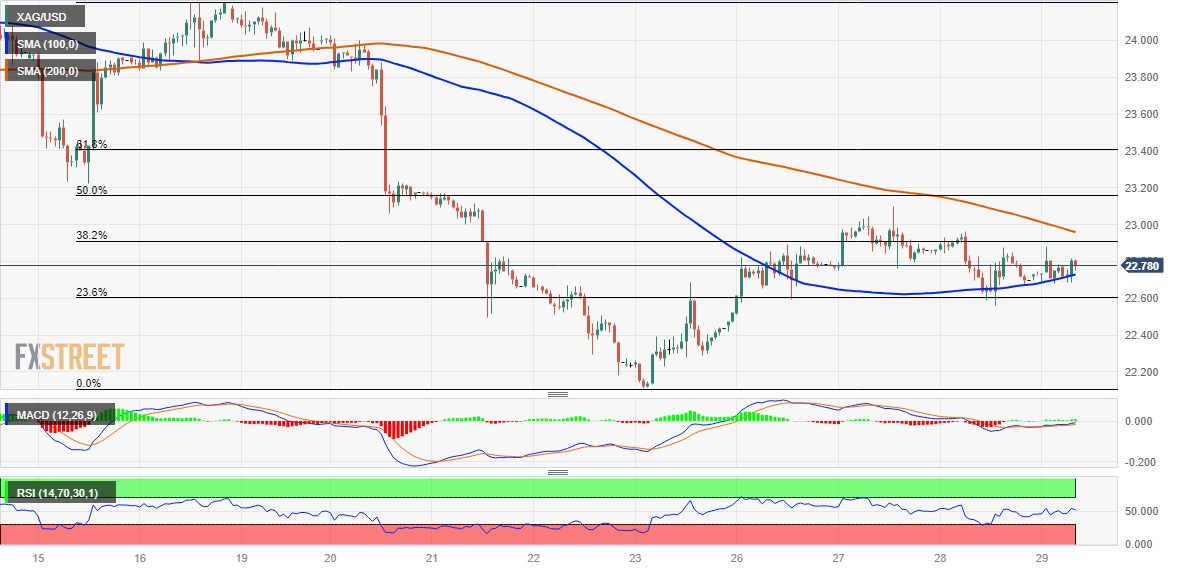
Silver attracts some buyers near the 100-hour Simple Moving Average (SMA) on Thursday and reverses a major part of its losses recorded the previous day; The white metal, however, struggles to make it through the 38.2% Fibonacci retracement level of the last week's downfall and trades around the $22.75-$22.80 region, up over 0.40% for the day during the first half of the European session.
From a technical perspective, the XAG/USD this week struggles to find acceptance above the $23.00 mark and faced rejection just ahead of the 50% Fibo. level. The subsequent downfall, however, stalls near the $22.55 confluence, comprising the 100-hour SMA and the 23.6% Fibo. level. The said areas should now act as a pivotal point, which if broken decisively will be seen as a fresh trigger for bearish traders. The XAG/USD might slide back to retest the multi-month low, around the $22.10 region touched last week.
Some follow-through selling below the $22.00 mark should pave the way for deeper losses and accelerate the fall further toward the $21.70-$21.65 zone. The downward trajectory could get extended further towards the next relevant support near the $21.25 region before the XAG/USD eventually drops to the $21.00 round figure.
On the flip side, any further intraday move up might continue to confront stiff resistance near the $23.00 mark, or 200-hour SMA. This is closely followed by 50% Fibo., around the $23.15 region, and the $23.40 area, or 61.8% Fibo. A convincing breakthrough the latter will confirm that the XAG/USD has formed a near-term bottom just ahead of the $22.00 mark and trigger a fresh bout of a short-covering rally. This should pave the for some meaningful appreciating move and lift the white metal to the $23.65-$23.70 hurdle.
Silver 1-hour chart
(Click on image to enlarge)
Key levels to watch
XAG/USD
| OVERVIEW | |
|---|---|
| Today last price | 22.79 |
| Today Daily Change | 0.09 |
| Today Daily Change % | 0.40 |
| Today daily open | 22.7 |
| TRENDS | |
|---|---|
| Daily SMA20 | 23.46 |
| Daily SMA50 | 24.04 |
| Daily SMA100 | 23.34 |
| Daily SMA200 | 22.54 |
| LEVELS | |
|---|---|
| Previous Daily High | 22.96 |
| Previous Daily Low | 22.56 |
| Previous Weekly High | 24.2 |
| Previous Weekly Low | 22.11 |
| Previous Monthly High | 26.14 |
| Previous Monthly Low | 22.68 |
| Daily Fibonacci 38.2% | 22.72 |
| Daily Fibonacci 61.8% | 22.81 |
| Daily Pivot Point S1 | 22.52 |
| Daily Pivot Point S2 | 22.34 |
| Daily Pivot Point S3 | 22.12 |
| Daily Pivot Point R1 | 22.92 |
| Daily Pivot Point R2 | 23.14 |
| Daily Pivot Point R3 | 23.32 |
More By This Author:
USD/JPY Whipsaws At Multi-Month High Below 145.00 On Fed Chair Powell SpeechEUR/USD Dives On Speculations For Additional Hikes After Fed Chair Powell Remarks
Pound Sterling Remains Capped Below 1.2800 As More Interest Rate Hikes Could Dampen UK Economy
Disclaimer: Information on these pages contains forward-looking statements that involve risks and uncertainties. Markets and instruments profiled on this page are for informational purposes only ...
more


