Silver Price Analysis: XAG/USD Bears Need To Wait For Break Below 38.2% Fibo. Near $24.30
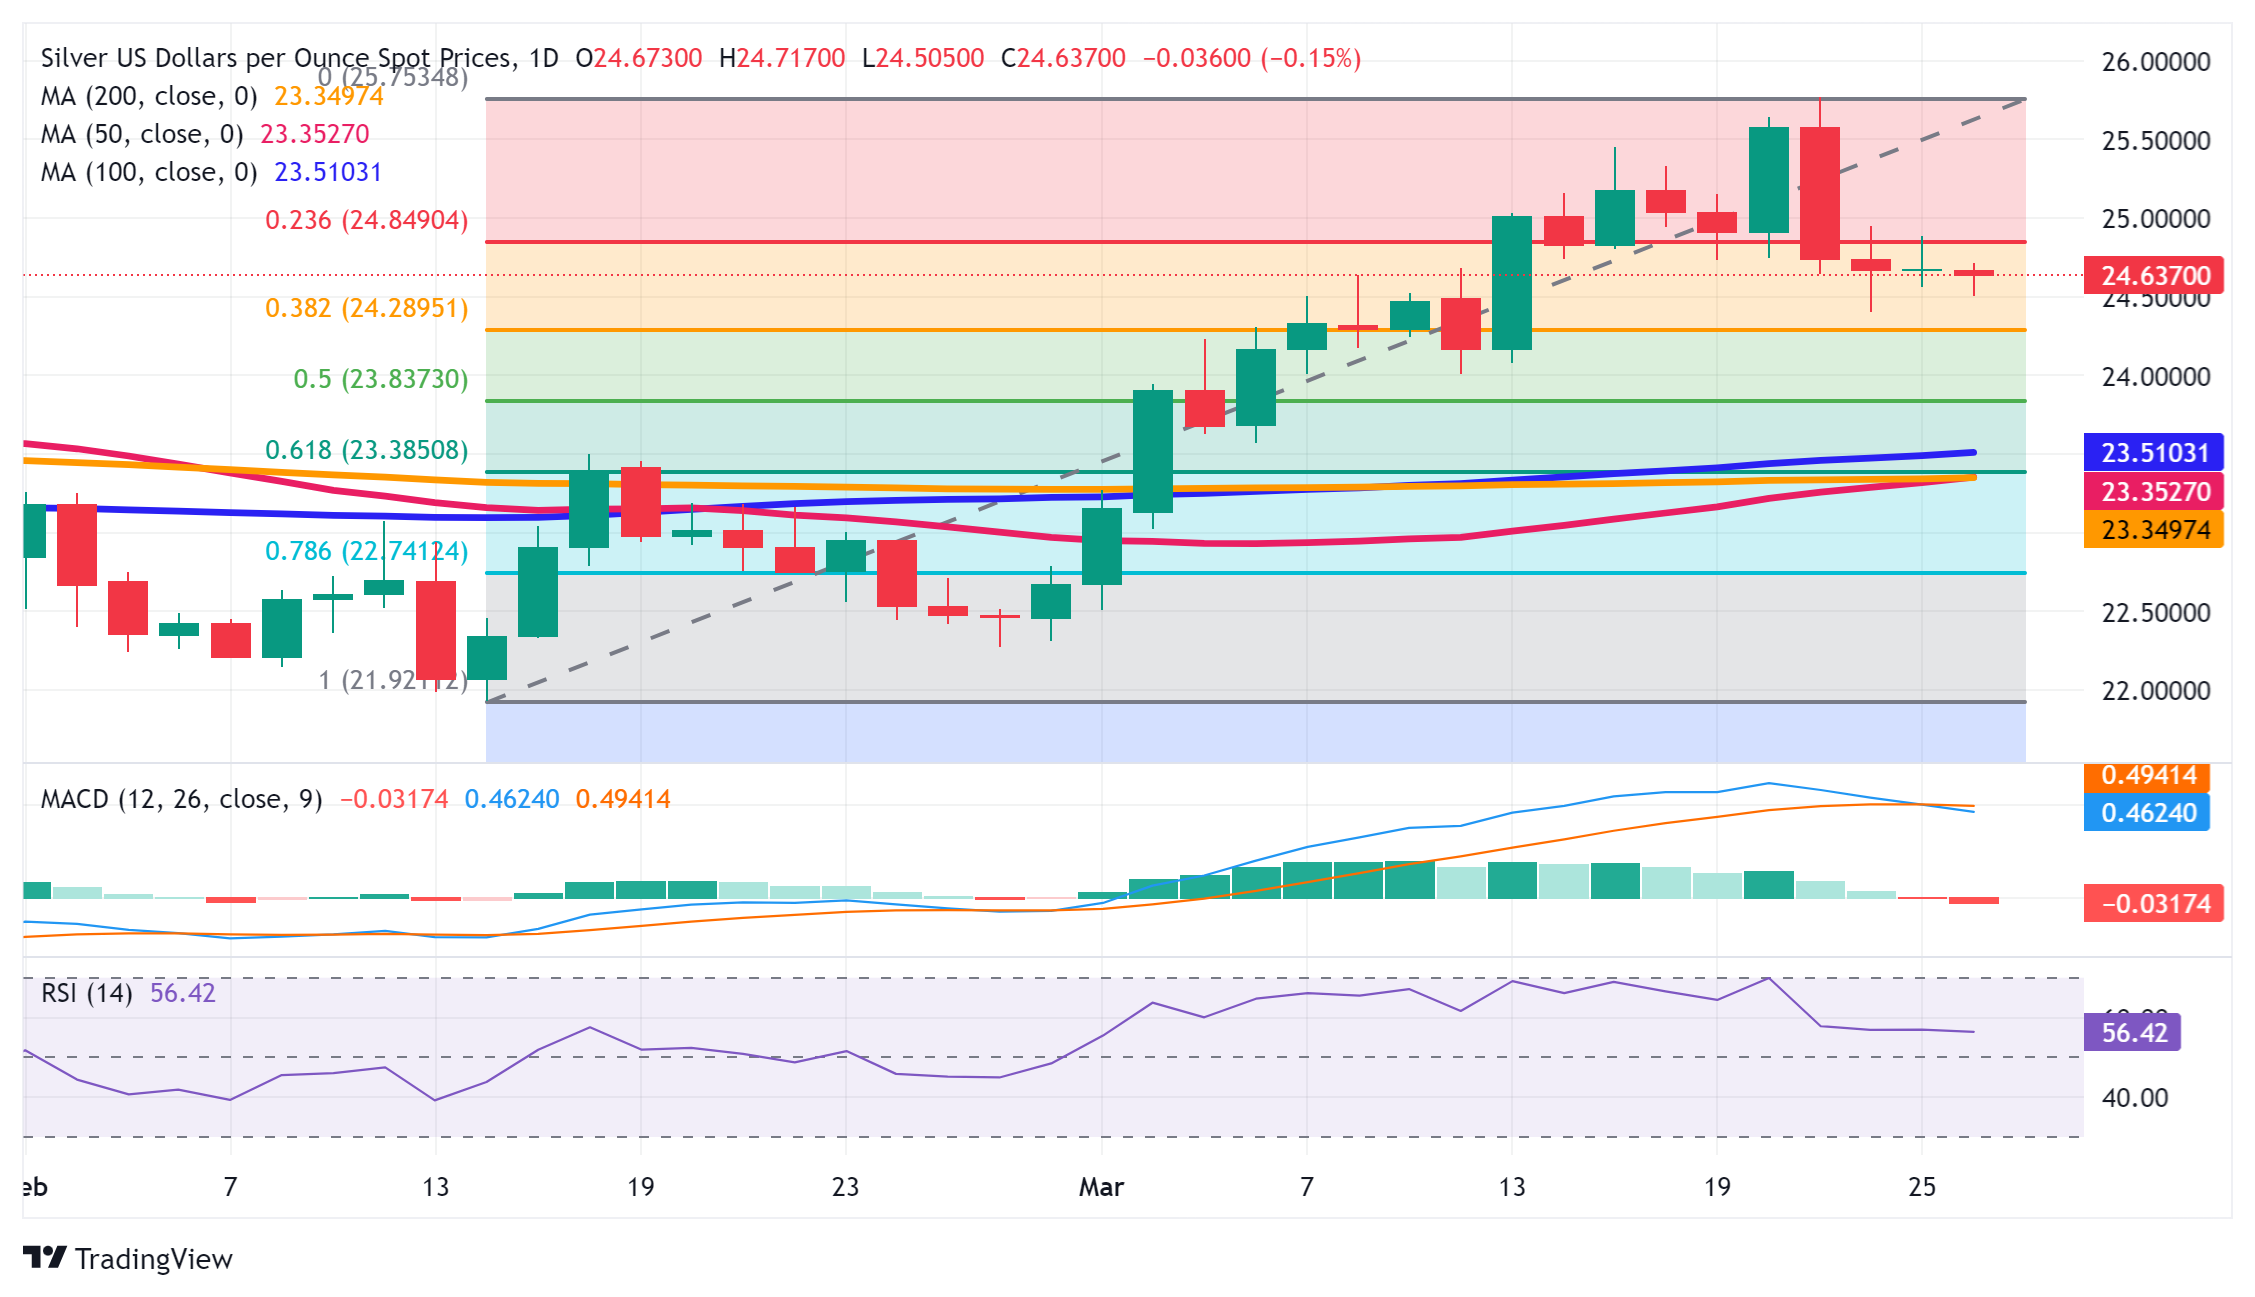
Silver (XAG/USD) comes under some selling pressure on Tuesday and remains depressed near mid-$24.00s through the first half of the European session. Meanwhile, the technical setup seems tilted in favour of bearish traders and supports prospects for an extension of last week's sharp retracement slide from the $25.75-$25.80 region, or its highest level since early December.
The XAG/USD now seems to have found acceptance below the $24.85-$24.80 horizontal support, which coincides with the 23.6% Fibonacci retracement level of the February-March rally. The subsequent slide, however, stalled near the $24.40 area, just ahead of the 38.2% Fibo. level, which should now act as a key pivotal point. Meanwhile, mixed oscillators on the daily chart make it prudent to wait for some follow-through selling below the said support before positioning for any further losses.
The XAG/USD might then accelerate the corrective decline further towards the $24.00 round figure before dropping to 50% Fibo. level support, around the $23.85 region. This is followed by the $23.35 confluence, comprising the 61.8% Fibo. and the very important 200-day Simple Moving Average (SMA). A convincing break below the latter will be seen as a fresh trigger for bearish traders and drag the white metal below the $23.00 mark, towards the next relevant support near the $22.45 region.
On the flip side, any attempted recovery is likely to attract fresh sellers and remain capped near the $25.00 psychological mark. That said, a sustained strength beyond the said handle might trigger a bout of a short-covering rally and lift the XAG/USD to the $25.50 region en route to the YTD peak, around the $25.75-$25.80 region. This is followed by the December 2023 swing high, just ahead of the $26.00 round figure, which if cleared decisively will set the stage for a further near-term appreciating move.
Silver daily chart
(Click on image to enlarge)
XAG/USD
| OVERVIEW | |
|---|---|
| Today last price | 24.63 |
| Today Daily Change | -0.04 |
| Today Daily Change % | -0.16 |
| Today daily open | 24.67 |
| TRENDS | |
|---|---|
| Daily SMA20 | 24.22 |
| Daily SMA50 | 23.32 |
| Daily SMA100 | 23.49 |
| Daily SMA200 | 23.34 |
| LEVELS | |
|---|---|
| Previous Daily High | 24.89 |
| Previous Daily Low | 24.56 |
| Previous Weekly High | 25.77 |
| Previous Weekly Low | 24.4 |
| Previous Monthly High | 23.5 |
| Previous Monthly Low | 21.93 |
| Daily Fibonacci 38.2% | 24.76 |
| Daily Fibonacci 61.8% | 24.69 |
| Daily Pivot Point S1 | 24.53 |
| Daily Pivot Point S2 | 24.38 |
| Daily Pivot Point S3 | 24.2 |
| Daily Pivot Point R1 | 24.85 |
| Daily Pivot Point R2 | 25.04 |
| Daily Pivot Point R3 | 25.18 |
More By This Author:
Gold Price Holds Steady Above $2,170 Level Amid Modest USD Weakness, Geopolitical Risks
USD/JPY Alternates Gains With Losses Near 151.50
EUR/USD bounces on broad USD selling, profit-taking
Disclaimer:
Besides this article I also use the Forex "Ranking, Rating and Score" which is also available once a week on my blog. In the article "Ranking, Rating ...
more


