
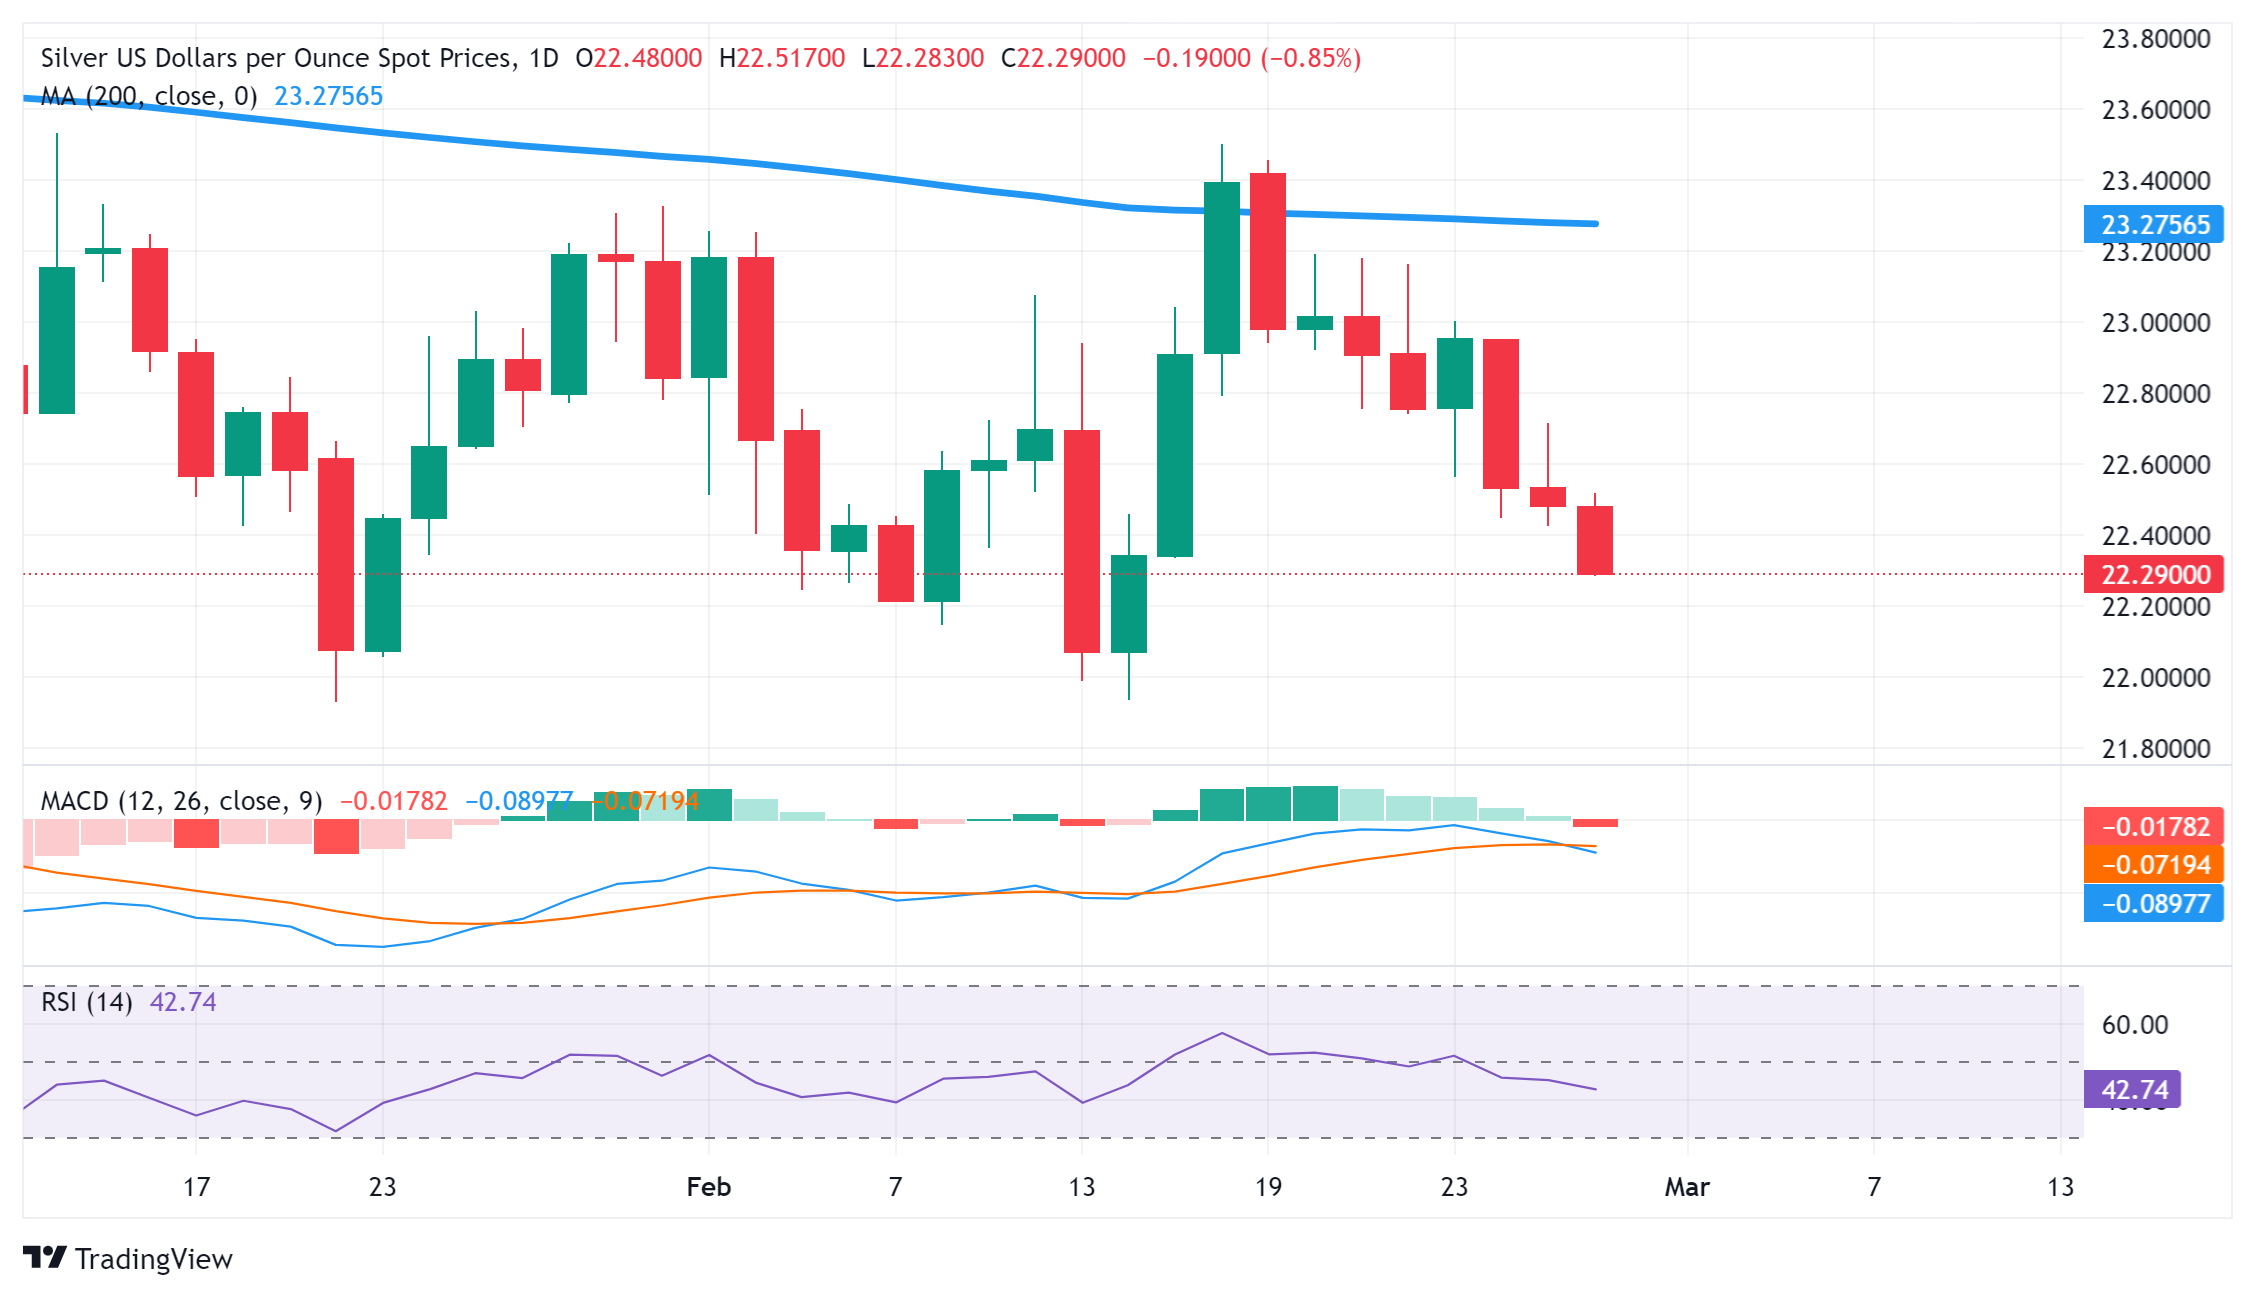
Silver (XAG/USD) remains under heavy selling pressure for the third successive day on Wednesday – also marking the fifth day of a negative move in the previous six and drops to over a two-week low during the first half of the European session. The white metal currently trades around the $22.30 region and seems vulnerable to prolonging its recent downfall witnessed over the past two weeks or so.
From a technical perspective, the recent failure to find acceptance above the very important and significant 200-day Simple Moving Average (SMA) and the subsequent decline validate the near-term negative outlook. Moreover, oscillators on the daily chart have just started gaining negative traction and further suggest that the path of least resistance for the XAG/USD remains to the downside.
Hence, some follow-through weakness towards retesting sub-$22.00 levels, or the two-month low touched in January, looks like a distinct possibility. A convincing break below the latter will be seen as a fresh trigger for bearish traders and pave the way for additional losses, dragging the XAG/USD towards the $21.40-$21.35 support zone.
On the flip side, the daily swing high, around the mid-$22.00s, now seems to act as an immediate hurdle ahead of the $22.70-$22.75 region. This is closely followed by the $23.00 round figure, which if cleared decisively might trigger a short-covering rally, though is likely to attract fresh sellers near the 200-day SMA, currently pegged around the $23.30 zone, and remain capped near mid-$23.00, or the monthly peak.
Silver daily chart
(Click on image to enlarge)
XAG/USD
| OVERVIEW | |
|---|---|
| Today last price | 22.3 |
| Today Daily Change | -0.18 |
| Today Daily Change % | -0.80 |
| Today daily open | 22.48 |
| TRENDS | |
|---|---|
| Daily SMA20 | 22.7 |
| Daily SMA50 | 23.04 |
| Daily SMA100 | 23.21 |
| Daily SMA200 | 23.28 |
| LEVELS | |
|---|---|
| Previous Daily High | 22.72 |
| Previous Daily Low | 22.42 |
| Previous Weekly High | 23.46 |
| Previous Weekly Low | 22.56 |
| Previous Monthly High | 24.09 |
| Previous Monthly Low | 21.93 |
| Daily Fibonacci 38.2% | 22.53 |
| Daily Fibonacci 61.8% | 22.6 |
| Daily Pivot Point S1 | 22.36 |
| Daily Pivot Point S2 | 22.25 |
| Daily Pivot Point S3 | 22.07 |
| Daily Pivot Point R1 | 22.66 |
| Daily Pivot Point R2 | 22.83 |
| Daily Pivot Point R3 | 22.95 |
More By This Author:
Bitcoin Commentary - Tuesday, Feb. 27
Eurozone Commentary - Tuesday, Feb. 27
Bitcoin Commentary - Monday, February 26


Comments
Log in or sign up to join the conversation.