
Silver (XAG/USD) remains under some selling pressure for the fourth successive day on Wednesday and drops to a near three-week low, below mid-$23.00s during the first half of the European session.
With the latest leg down, the XAG/USD confirms a breakdown through the 50% Fibonacci retracement level of the $22.51-$24.61 move up and seems vulnerable to decline further. The negative outlook is reinforced by the fact that technical indicators on the daily chart have again started gaining negative traction and are holding deep in the negative territory on hourly charts. This, in turn, suggests that the path of least resistance for the white metal is to the downside.
Any subsequent slide, however, is likely to find some support near the 61.8% Fibo. level, around the $23.30 region, ahead of the $23.15 zone, representing a multi-month-old ascending trend-line support, and the $23.00 round-figure mark. The latter should act as a key pivotal point, which if broken decisively will be seen as a fresh trigger for bearish traders and pave the way for an extension of the recent downfall witnessed over the past week or so.
The XAG/USD might then accelerate the downfall further towards the December monthly swing low, around mid-$22.00s, before dropping to the $22.25 support and the $22.00 round-figure mark.
On the flip side, recovery back above the $23.55 region (50% Fibo. level) might now be seen as a selling opportunity near the $23.75-$23.80 area, or the 38.2% Fibo. level. This is closely followed by the $24.00 mark, which if cleared decisively will suggest that the recent corrective slide has run its course and push the XAG/USD further towards the $24.60 area (December 22 high). Bulls might eventually aim to reclaim the $25.00 psychological mark.
Silver 4-hour chart
(Click on image to enlarge)
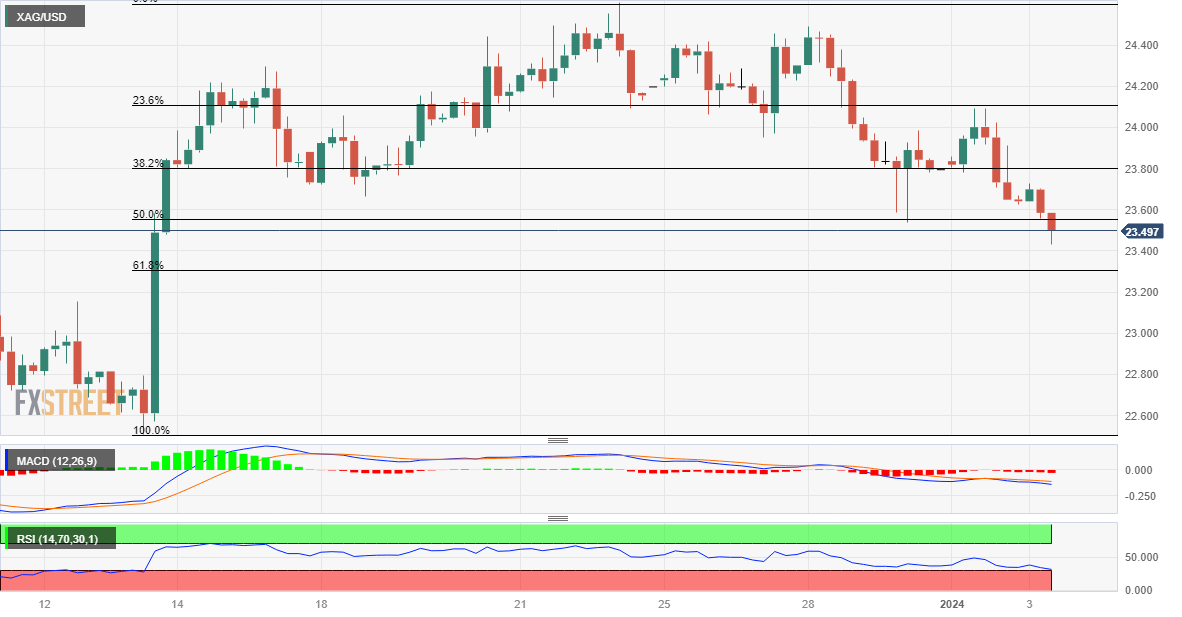
Technical levels to watch
XAG/USD
| OVERVIEW | |
|---|---|
| Today last price | 23.45 |
| Today Daily Change | -0.21 |
| Today Daily Change % | -0.89 |
| Today daily open | 23.66 |
| TRENDS | |
|---|---|
| Daily SMA20 | 23.83 |
| Daily SMA50 | 23.65 |
| Daily SMA100 | 23.3 |
| Daily SMA200 | 23.67 |
| LEVELS | |
|---|---|
| Previous Daily High | 24.09 |
| Previous Daily Low | 23.64 |
| Previous Weekly High | 24.49 |
| Previous Weekly Low | 23.54 |
| Previous Monthly High | 25.92 |
| Previous Monthly Low | 22.51 |
| Daily Fibonacci 38.2% | 23.82 |
| Daily Fibonacci 61.8% | 23.92 |
| Daily Pivot Point S1 | 23.5 |
| Daily Pivot Point S2 | 23.35 |
| Daily Pivot Point S3 | 23.05 |
| Daily Pivot Point R1 | 23.95 |
| Daily Pivot Point R2 | 24.25 |
| Daily Pivot Point R3 | 24.4 |
More By This Author:
GBP/USD Trades Higher Near 1.2630 Amid Weaker UK Business Confidence, US Data EyedS&P 500 Kicks Off 2024 With A Bearish Tone On Tuesday, Slips Back Towards $4,700
Canadian Dollar Extends Declines Against Greenback On Softer PMI Data, Weaker Crude Oil


Comments
Log in or sign up to join the conversation.