
Silver: Patience Pays Off
There is much that can be said about why silver hasn’t performed this year. Yet, when looking over the last twenty months rather than just the past year, silver had a stunning performance. It more than doubled in price to where it is trading now. How often does that happen in precious metals? With silver, patience pays off.
Here is what you should consider when asking why silver isn’t trading even higher. First, after an initial up-leg like this, a trend is set in motion, but it is just the beginning of a trend. It needs time to develop. Most of the reasons debated this year when silver stepped into the limelight were the same reasons that traders anticipated fueling the first leg.
A big part of this is that it takes time for the public to digest the market, which is ahead of reality; a speculative prognosis on how the future might look. There is a trickle-down effect until silver can build up its second leg. From an active market speculator perspective, inflation is real, but years can pass until the crowd realizes what is going on. Then gold needs to move, which in turn awakens silver with a delay.
Gold in US Dollars, Monthly Chart: Bull as Bull Can Be
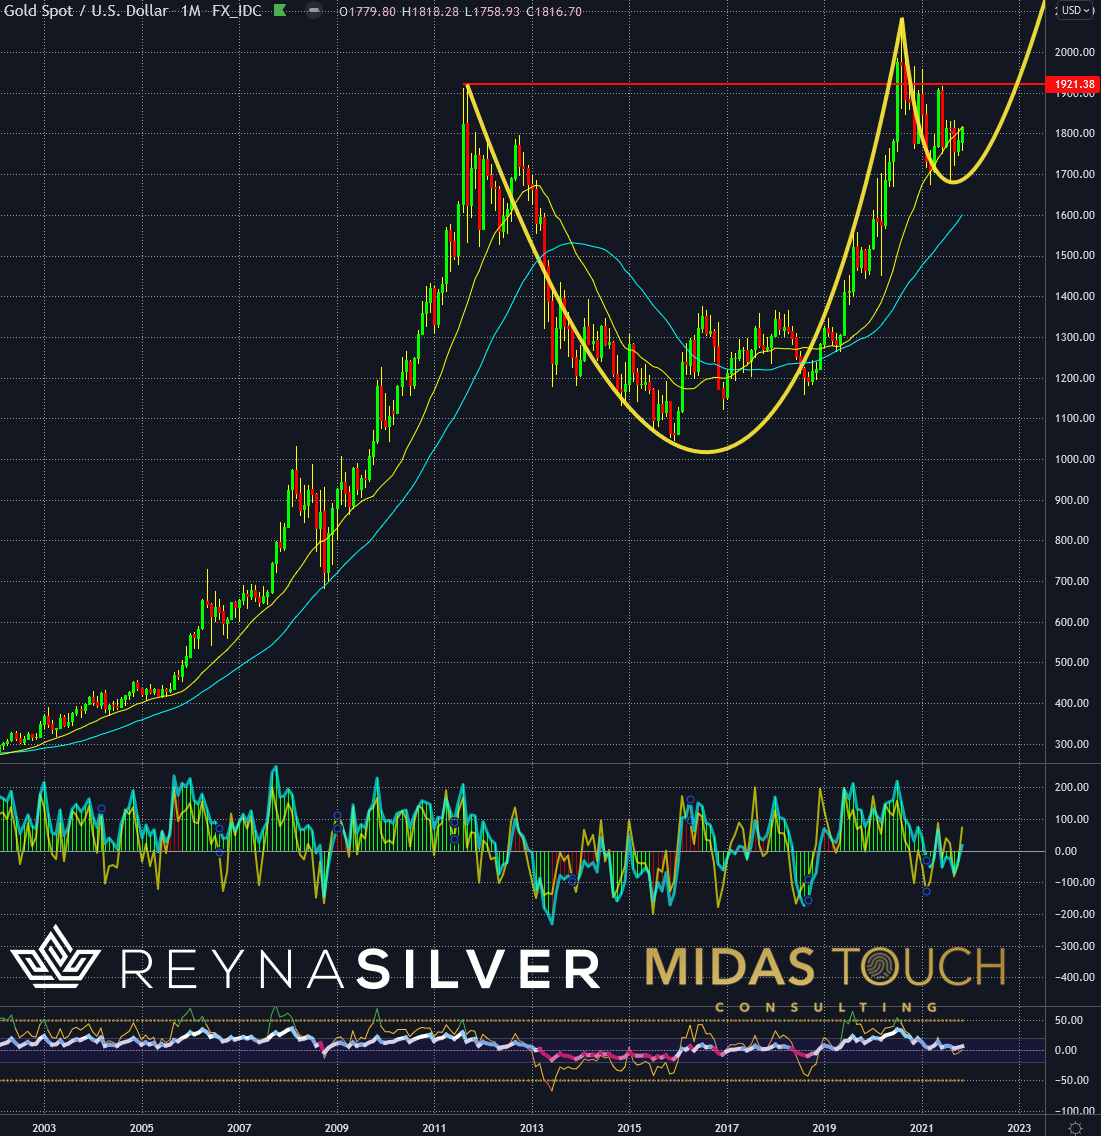
Gold in US dollars, monthly chart as of Nov. 5, 2021.
The monthly gold chart above shows the strong bullish trend in gold over the last twenty years. Telltale indicators include the higher high in 2020 versus 2011 and the price strength since.
Gold in US Dollars, Weekly Chart: Getting Ready
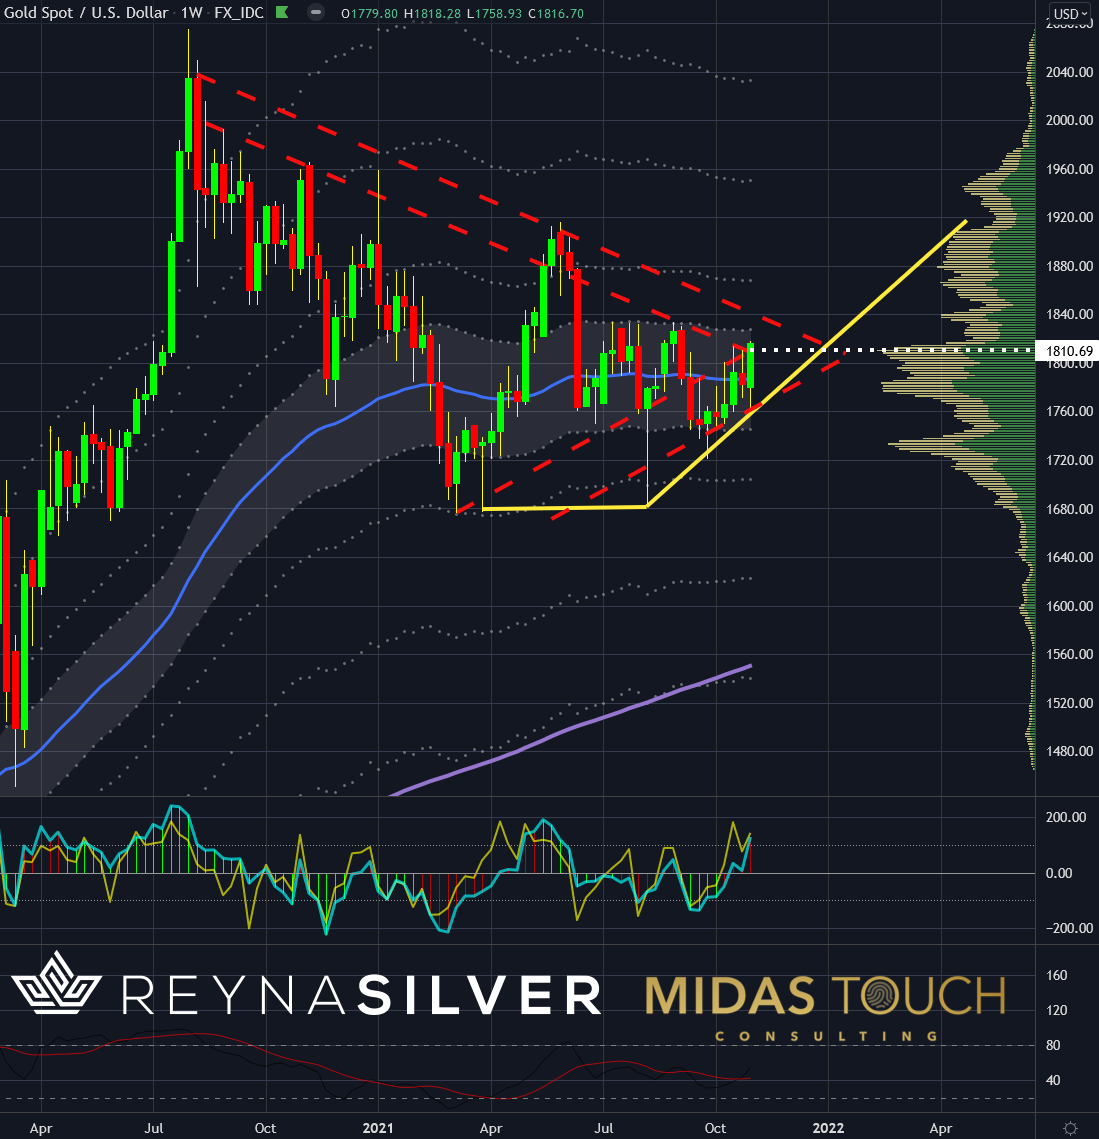
Gold in US dollars, weekly chart as of Nov. 5, 2021.
The weekly chart has just come alive to an exciting inflection point. A closer look reveals that the price has successfully built a second leg from the $1,680 double bottom price zone (yellow lines). The next few weeks should reveal if a double triangle formation (red lines) may be severed now that the price is trading above POC support of a fractal volume study (white line).
Silver in US Dollars, Weekly Chart: Looking Good
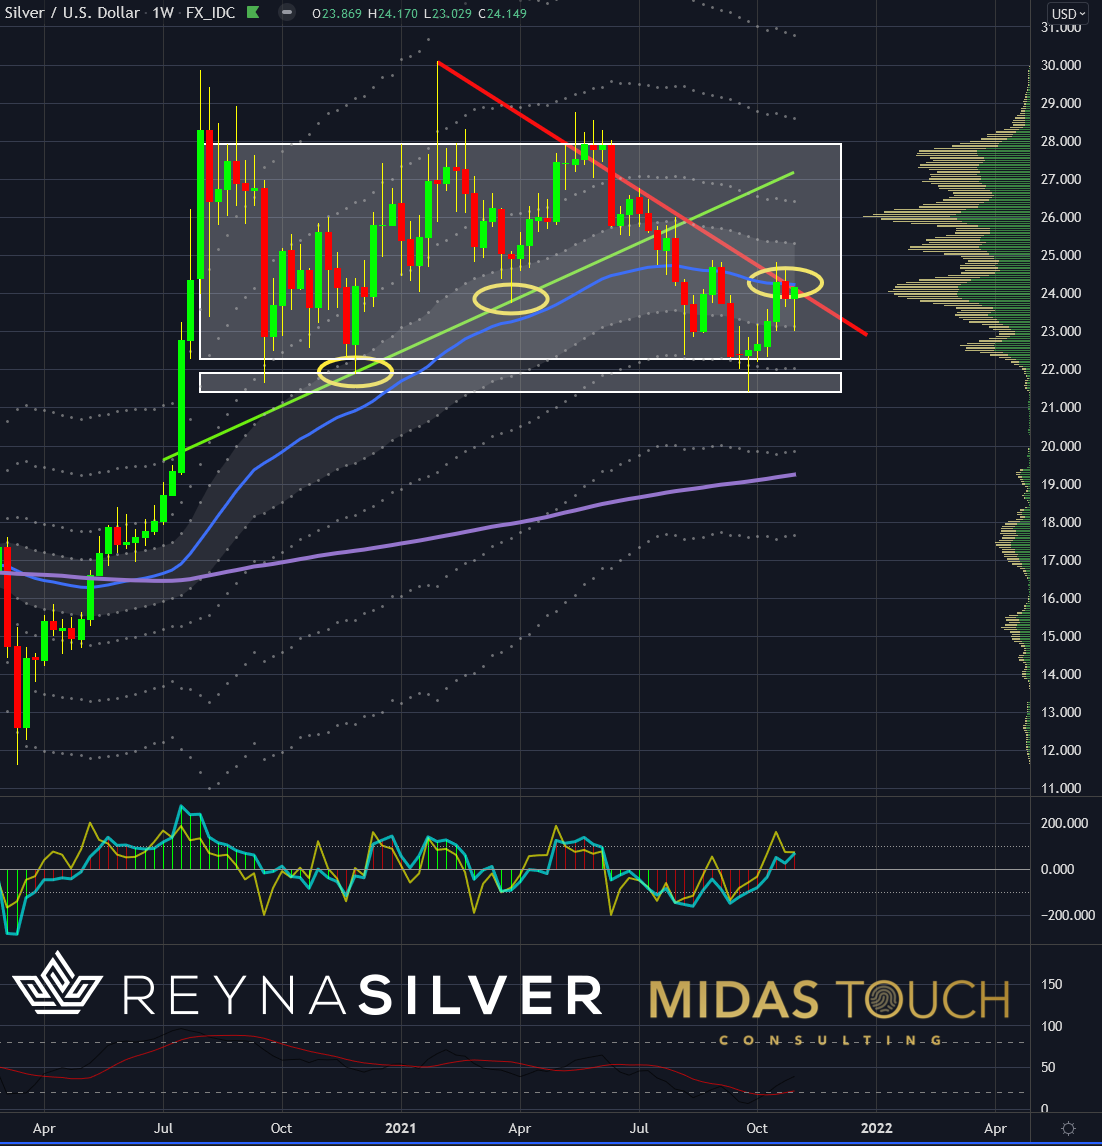
Silver in US dollars, weekly chart as of Nov. 5th, 2021.
The weekly silver chart is bullish as well. Bulls have successfully defended the yearly range lows zone (slim white box). They mutually are attacking an overhead resistance with quite some might, and the upcoming weeks might see the price successful in that attempt.
Silver in US Dollars, Monthly Chart: History as a Guide
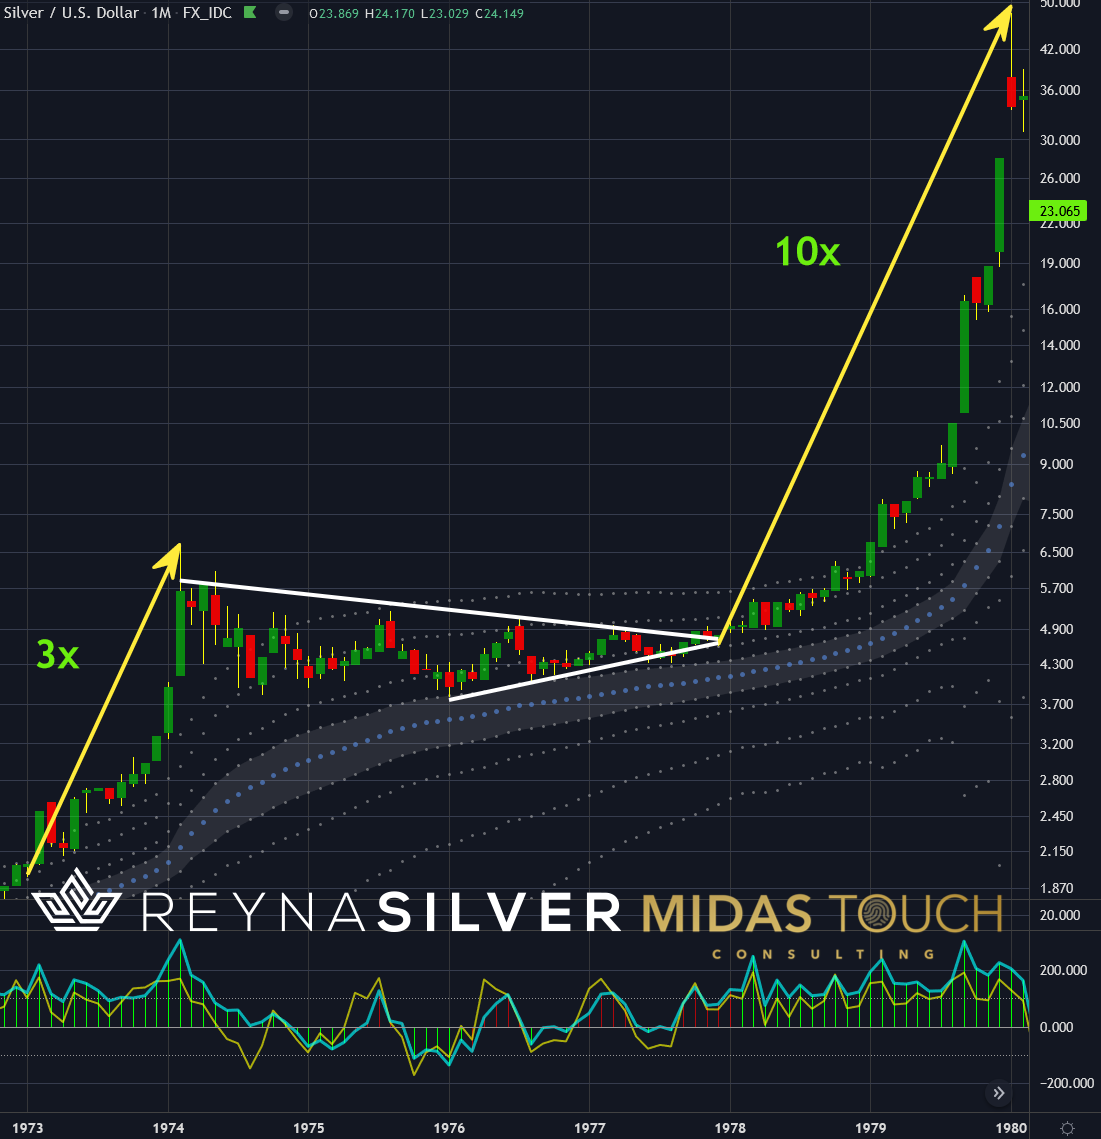
Silver in US dollars, monthly chart as of Nov. 5, 2021.
The monthly chart above illustrates an excellent example of how much patience is needed to earn significant profits from a silver investment. In this case, silver initiated a range break in 1973, where prices tripled within a year.
This is much like silver’s recent move from March of last year to the current top in February of this year. It showed a similar percentage move. This first leg of a bullish trend required more than three years of investors' patience before the second leg was initiated. Those patient enough to hold on were rewarded with a near thousand percent price increase.
We find the last phase of silver in a sideways range. If anything encourages a substantial second leg up in the making, it would be extremely rewarding to the patient owner of physical holdings.
Disclaimer: This article does not contain investment advice or recommendations. Every investment and trading move involves risk, and readers should conduct their own research when making a ...
more

