

Image Source: Pixabay
Investing in silver is not for the faint-hearted. The silver market is complex and often characterized by restless volatility, making it a challenging asset to analyze.
Related Research - Will silver ever hit $50 an Ounce?
In this article, we present an in-depth analysis of the silver chart, focusing on both the price and timeline aspects of its chart. We use our proprietary methodology that combines technical analysis and Fibonacci principles applied to both price levels and timeframes.
Understanding the Complexity of Silver Investments
Silver is known for its volatile nature. This volatility can be daunting for investors, making it difficult to predict price movements and requiring a strong stomach to handle the market's ups and downs.
Moreover, the silver chart itself can be quite complex. Patterns may not always follow conventional technical analysis rules, and the interplay of various market forces can create confusing signals.
This is where our unique methodology comes into play, offering a structured approach to deciphering the chaos and identifying key trends and opportunities.
A methodology introduces structure, and avoids dreaming of unrealistic targets. While we believe that silver may ultimately hit $100 an Ounce, we must take a phased and methodological approach to this type of high price targets.
Silver Price Analysis
Let's start by examining the critical price point for silver, which we refer to as the 'line in the sand' level—28.88 USD/oz. This price is significant for several reasons:
- Breakout Level: On the daily chart, 28.88 USD/oz marks a crucial breakout level. When silver crosses this level, it signals a potential shift in market sentiment from bearish to bullish.
- Fibonacci Extension: This price also represents the 100% Fibonacci extension level of 14.4, a historically important point on the silver chart. The Fibonacci extension levels are derived from the Fibonacci sequence, a series of numbers that frequently appear in nature and financial markets, and are used to predict future price movements.
Understanding these factors helps us appreciate why 28.88 USD/oz is such a pivotal threshold for silver.
It is not just a random number but a convergence of key technical indicators that signify a major potential turning point in the market.
(Click on image to enlarge)
Silver Timeline Analysis
Now, let's turn our attention to the timeline analysis—a unique aspect of our methodology. This involves applying Fibonacci principles not just to price but also to time, which is less common and provides a different perspective on market movements.
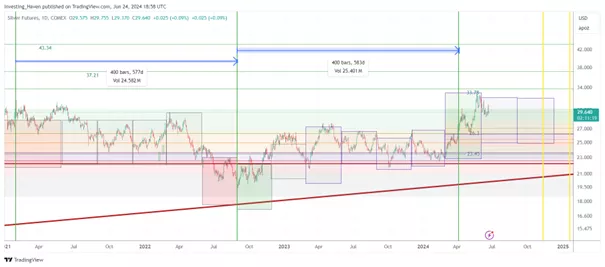
We do our analysis based on the daily silver price chart shown above.
The silver chart, on a daily timeframe, shows that it took 2x 400 trading days to complete a bullish W-pattern. This pattern is a strong indicator of potential upward movement. Here’s how we apply Fibonacci numbers to understand the timeline for silver’s consolidation and future movements:
- Fibonacci Numbers and Time: Fibonacci numbers are used to predict future events in financial markets. In this case, we use percentages of 400 days (the period it took to form the W-pattern) to estimate the duration of the ongoing consolidation.
- 38.2% of 400 Days: This equals approximately 153 days. Based on this, we estimate that the consolidation around the breakout level of 28.88 USD/oz might continue until November 8th, 2024. Around this date, silver could start its next bullish phase, potentially reaching $50. This date is represented by the first yellow vertical line on the chart.
- 50% of 400 Days: This results in 200 days, bringing us to January 21st, 2025. This is another critical date when we might see significant movements in silver’s price. This date is represented by the second yellow vertical line on the chart.
By applying Fibonacci principles to both price and time, we can provide a more comprehensive analysis of the market. This approach sets our methodology apart, offering deeper insights into the potential future movements of silver.
Conclusion
In this article, we have shared our detailed analysis of the silver market, focusing on key price levels and the timeline for potential movements. By combining traditional technical analysis with Fibonacci principles applied to time, we offer a unique perspective on where the silver market might be headed.
As we approach the decisive dates of November 8th, 2024, and January 21st, 2025, we will continue to monitor the market closely. This scenario is not a forecast but a way to illustrate our methodology. Stay tuned for further updates as we navigate the exciting and dynamic silver market in 2024 and beyond.
Understanding the silver market's complexity and volatility is crucial for making informed investment decisions. Our proprietary methodology aims to simplify this process, offering clarity and actionable insights in an otherwise turbulent market.
More By This Author:
June 13, 2024 – A Decision Point For Crypto Markets This SummerOctober Of 2024 Will Be Crucial Month For Cryptocurrency Investors
Crypto Momentum Fading - Are Buy The Dip Opportunities Underway?


Comments
Log in or sign up to join the conversation.