

Image Source: Unsplash
Gold and silver were both a touch firmer on Tuesday after making a weaker start to the week. Last week saw silver post its best weekly gain since mid-May, rising about 7%, while gold rose a solid 2.2% on the week. Silver’s more impressive gains came as the metal broke out of a technical continuation pattern and with the dollar falling against a basket of foreign currencies thanks to weakness in US data, raising investor expectations about a September rate cut by the US Federal Reserve. Concerns about the French elections on Sunday had also played a part in boosting precious metals’ appeal last week. But after a surprise win for left-wing alliance, which helped to keep Le Pen’s far right from power, this meant that some haven demand would drop out of the equation and explains why both gold and silver started the week on the backfoot. This week, it is all about US inflation data on Thursday, which puts the dollar and dollar-denominated assets like gold and silver in sharp focus. Ahead of the CPI data, Fed Chair Powell will be testifying before the Senate Banking Committee, in Washington DC today. Despite their subdued start to the week, my XAGUSD and XAUUSD forecast remains bullish, as I reckon both metals, especially the former, may have long ways to go on the upside. Therefore, dip-buying remains a preferred strategy in precious metals.
Dollar steadies after last week’s drop
Last week’s US data largely disappointed expectations, including the ADP private payrolls, unemployment claims, factory orders, and ISM manufacturing and services PMIs. The June payroll data released on Friday was also disappointing, despite the headline jobs growth exceeding expectations with a print of 206,000. However, significant downward revisions to the previous two months, with 111,000 fewer jobs added than initially reported, caused the three-month moving average of jobs created to its lowest point since January 2021. As a result, we saw the dollar fall across the board, causing the Dollar Index to end lower by nearly 1% on the week. The DXY was bouncing backing at the start of this week, however, as uncertainty remained over the French political space while the yen resumed slide after a brief recovery at the end of last week.
Upcoming CPI Data
The focus now turns to the latest Consumer Price Index (CPI) measure of inflation, to be released on Thursday, July 11. After a weaker-than-expected rise of 0.2% in monthly core CPI and a flat headline reading, US dollar bears were hoping for a more pronounced drop last month. Instead, the greenback held its ground, especially against the yen and euro, until it dropped on weak US economic data last week. This supported currencies where the central bank is more hawkish than the Fed, such as the AUD. Another weaker-than-expected CPI print might lead to expectations that the disinflation process has resumed, boosting the appeal of precious metals, especially silver, which recently showed a fresh bullish signal by breaking out of its flag pattern.
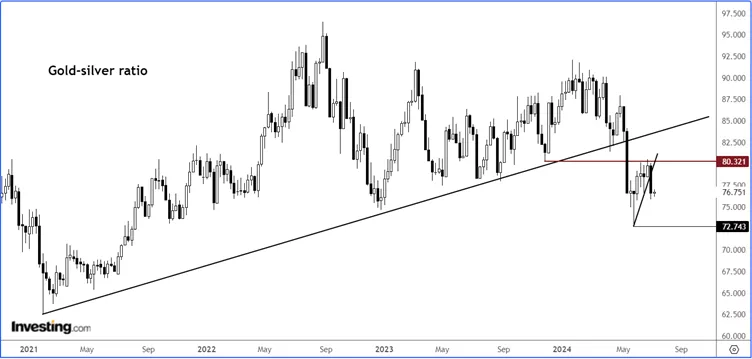
Gold-Silver Ratio Indicates Silver’s Potential
The gold-silver ratio dropped last week after reaching a key resistance area between 80.30 and 80.55. This follows a significant breakdown below a multi-year bullish trend line in early May. Given that the gold-silver ratio has held resistance here, it suggests that silver might outperform gold again.
(Click on image to enlarge)
Silver (XAGUSD) Technical Analysis and Trade Ideas
Until last week’s recovery, silver had been trending lower in recent weeks. However, after testing a major support area around $28.70 to $29.00, buyers have evidently stepped back in, pushing silver back above several short-term resistance levels. Some of these levels will need to hold to maintain the renewed bullish trend. Silver has reclaimed the bullish trend line in place since February, climbed back above the 21-day exponential average, and more importantly, broken the resistance trend of its bull flag pattern around the $30.00 to $30.20 area.
(Click on image to enlarge)
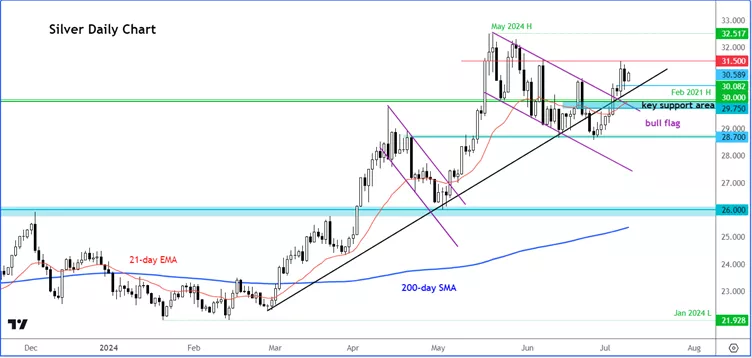
Key Support and Resistance Levels
The $30.00-$30.20 range is now a key support area to monitor this week, especially in light of upcoming CPI data. Ahead of this area, there is a shorter-term support level around $30.50 zone to watch.
The critical level is around $28.70, representing the recent lows. A potential break below this area would invalidate the bullish view, given that we have now seen an interim higher high and a breakout from the bull flag pattern to the upside.
Upside Targets
For upside targets, $31.50 is the first line of defence for the bears, followed by $32.00 and then the May high just above $32.50.
Long-term Outlook: Silver sets stage for a rally to $35
(Click on image to enlarge)
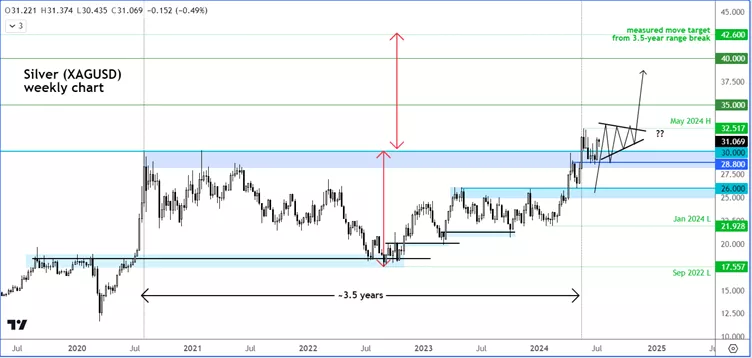
Looking at the long-term weekly chart, silver could be on the verge of a much bigger move, having recently broken out of a long-term consolidation zone. As it stands, silver might rise towards $35.00 in the coming weeks, if not higher.
More By This Author:
GBP/USD: UK Elections And Key US Data In Sharp Focus
Gold: After A Grey June, Could The Metal Shine In July?
EUR/USD In Sharp Focus As French Election Looms


Comments
Log in or sign up to join the conversation.