
Silver Commodity Elliott Wave Technical Analysis
Silver Elliott Wave Analysis
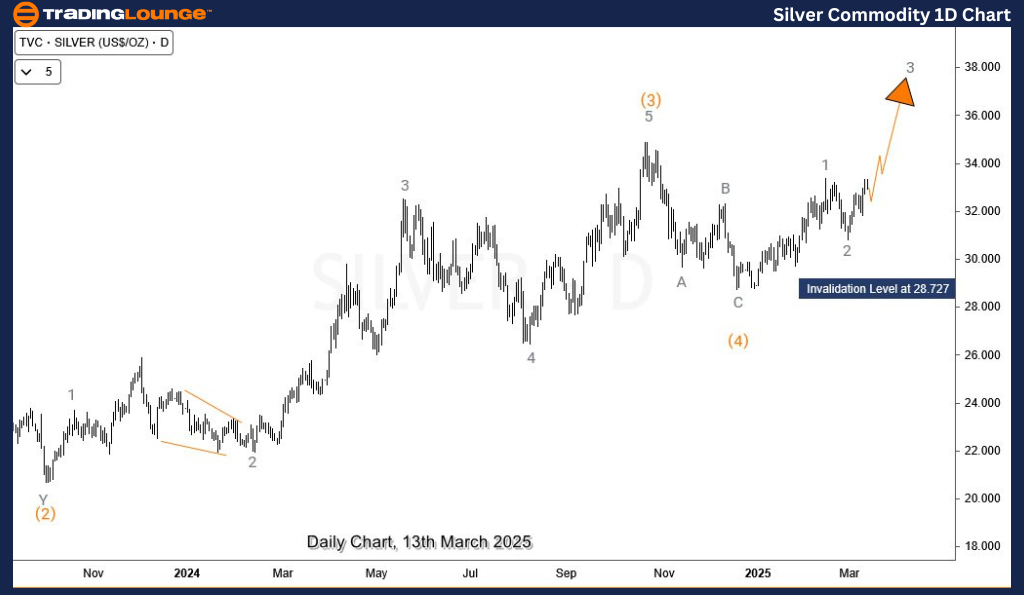
Silver has been within the bullish impulse wave formation since August 2022. The rally should continue above the October 2024 high to establish a new high for this bullish cycle. In the short term, a sub-impulse wave is emerging from December 2024 which could extend above $40 in the coming weeks.
Daily Chart Analysis
The daily chart shows the bullish impulse cycle from August 2022 where wave II of the cycle degree ended. Wave III emerged from that low and is still within its first sub-wave, i.e, wave ((1)) of I. The commodity started wave (5) of ((1)) of I from December 2024 where wave (4) finished. After completing waves 1 and 2 of (5), traders should expect rllies to continue on the path of (5) of ((1)) with potential for $40 in the coming weeks.
H4 Chart Analysis
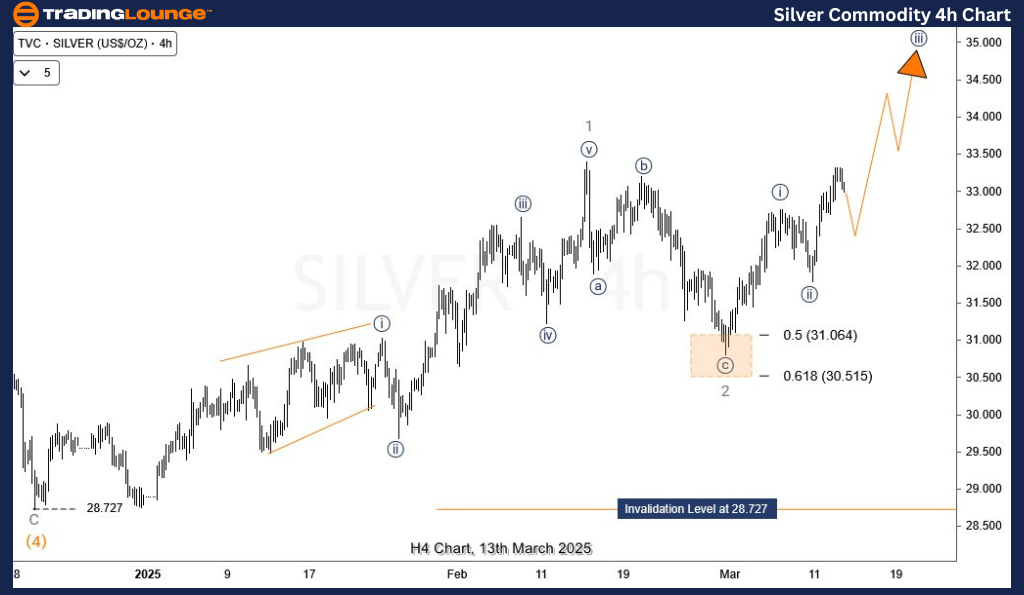
On the H4 chart, wave 3 started in late February 2025 at around $30.8. It now appears like waves ((i)) and ((ii)) of 3 have finished. Considering their sizes, we can expect wave ((iii)) to be extended. Alternatively, the wave count from 28th February low could be (i) and (ii) of ((i)) leading to a potential wave 3 extension. In either case, more rallies are expected and buyers can wait for pullbacks to position themselves.
Technical Analyst : Sanmi Adeagbo
More By This Author:
Elliott Wave Technical Analysis: Euro/U.S. Dollar - Thursday, March 13
Bitcoin Crypto Price News Today Elliott Wave Technical Analysis
Expert Elliott Wave Analysis: S&P 500, Nasdaq 100, DAX40, FTSE 100 & ASX 200 Trading Insights
At TradingLounge™, we provide actionable Elliott Wave analysis across over 200 markets. Access live chat rooms, advanced AI & algorithmic charting tools, and curated trade ...
more

