Silver Chartbook – Silver With A Turbo
Tied to the hip to Gold, it is essential to keep an eye on the Gold/Silver-ratio. Silver is still stretched, lagging, while Gold is currently taking a breather and hence getting ready to approach the US$2,000 mark. Most likely gold will go beyond that level. It isn’t far-fetched to expect sooner or later a rubber band effect of Silver needing to catch up, and once it breaks the US$30 level, it might as well accelerate much faster than expected. Silver with a turbo.
Recent trading sessions have driven Silver and Gold to lower levels. Still, Silver already shows relative strength within the precious metal sector. As a result, we might witness one of the last cheap points for adding to one’s physical Silver holdings.
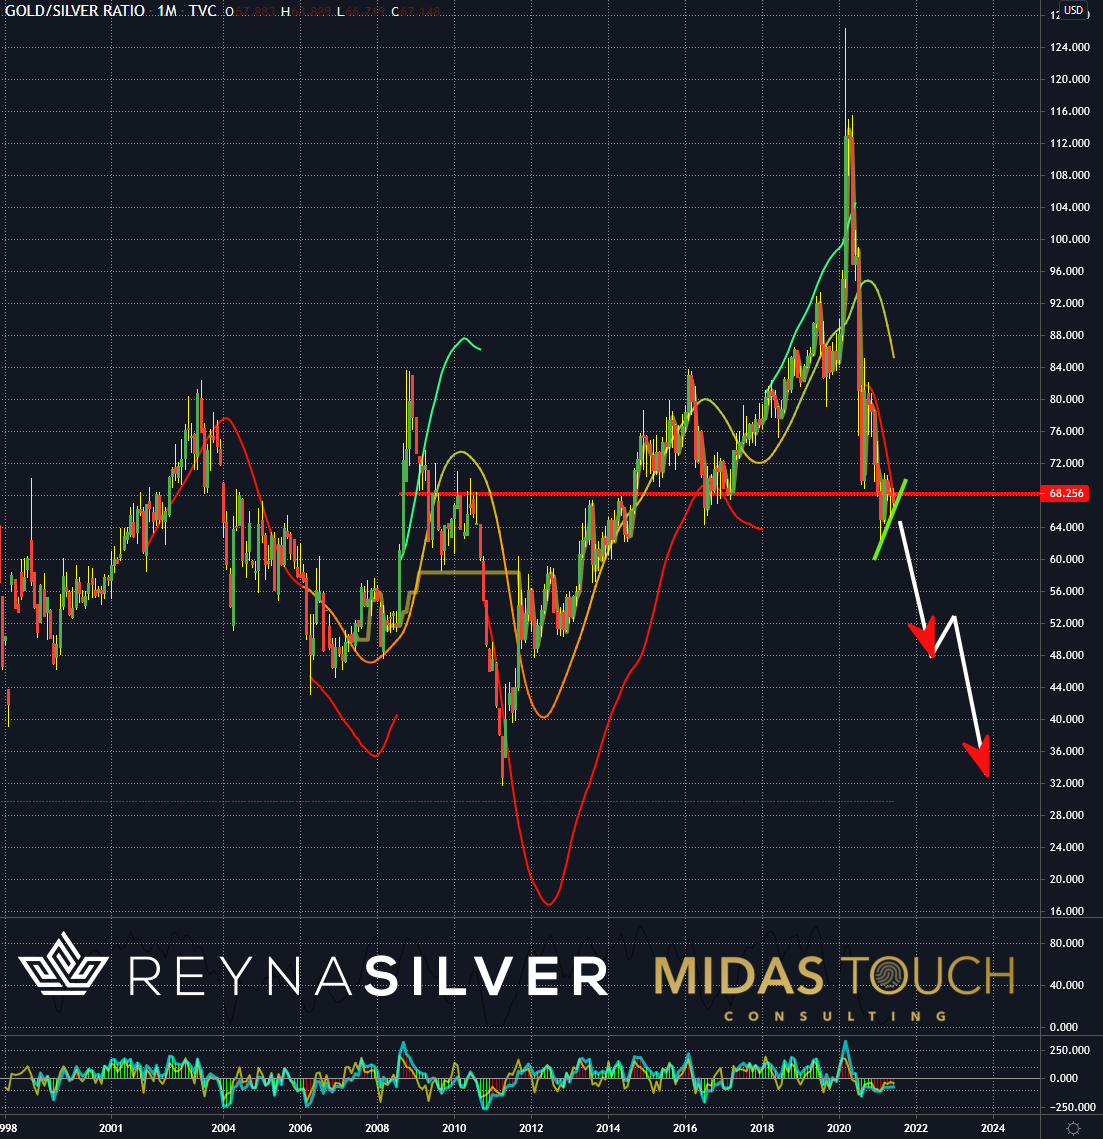
Gold/Silver-Ratio, Monthly Chart, How much?
(Click on image to enlarge)

Gold/Silver-Ratio, monthly chart as of June 17th, 2021.
The Gold/Silver-ratio can help identify relative strength/relative weakness relationships between the two metals. Consequently, it is mighty helpful to guestimate which of the ones is moving first. Furthermore, one can time one’s trade placements. In addition, it is a barometer of the overall larger picture for long-term assessments from a fundamental perspective.
A look at the monthly Gold/Silver-ratio shows that Silver is pushing against a support level, which, if breaking, could lead to a two-legged move, adding a 50% turbo boost to Silver prices in relation to Gold (red arrows down).
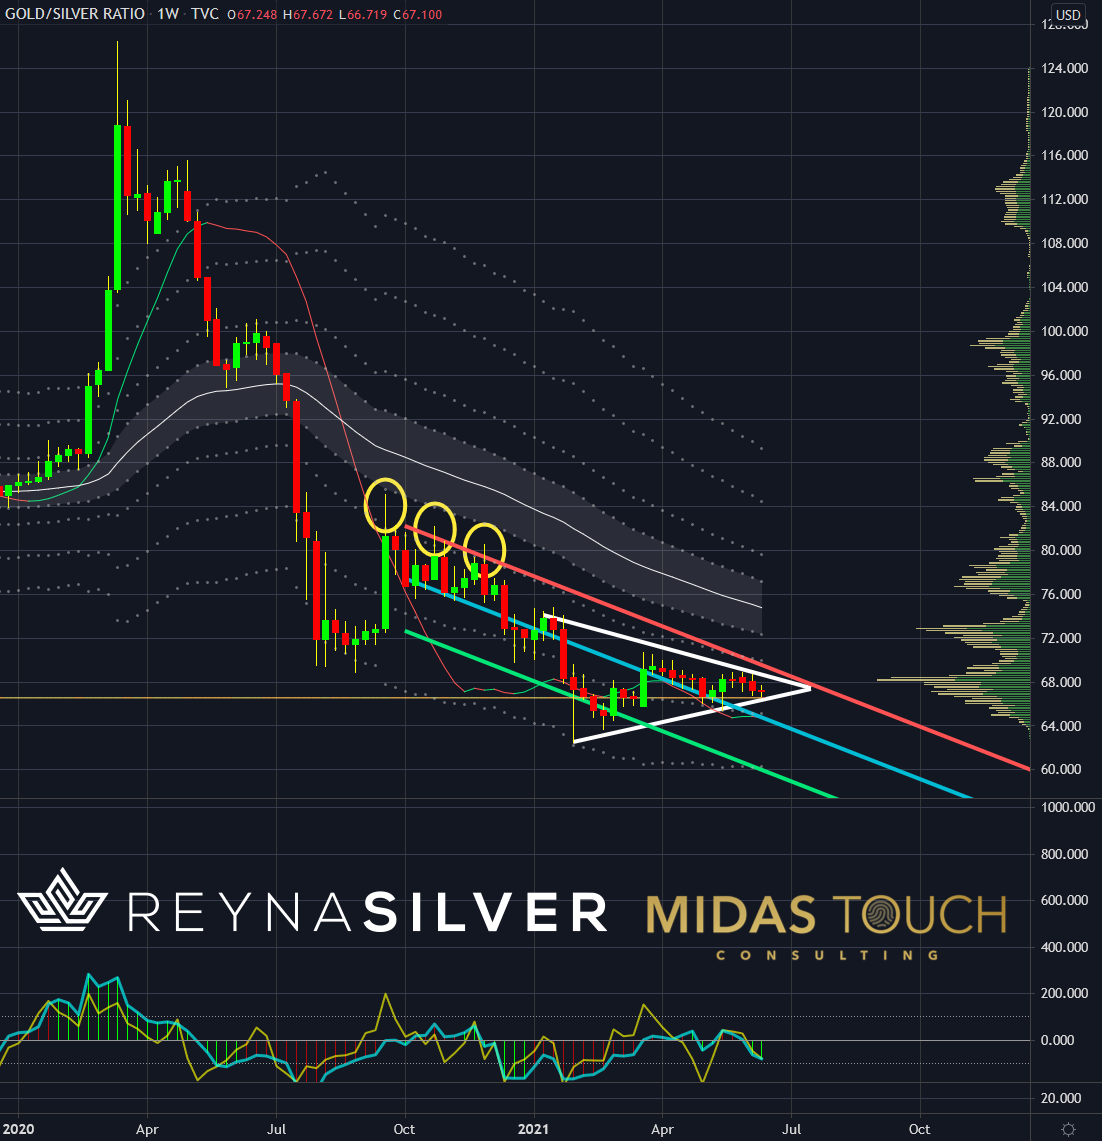
Gold/Silver-Ratio, Weekly Chart, Trending down:
(Click on image to enlarge)

Gold/Silver-Ratio, weekly chart as of June 17th, 2021.
Now zooming in to the weekly time frame, we can see that the ratio is trending down. Consequently, Silver is catching up with Gold. Typically, once the ratio price meets the upper red regression line (yellow circles), it consequently declines.
Trading in a triangle would mean that a lower white support line break could initiate a more volatile downward movement. Consequently, this would represent added turbo fuel to a more sustainable Silver upward movement.
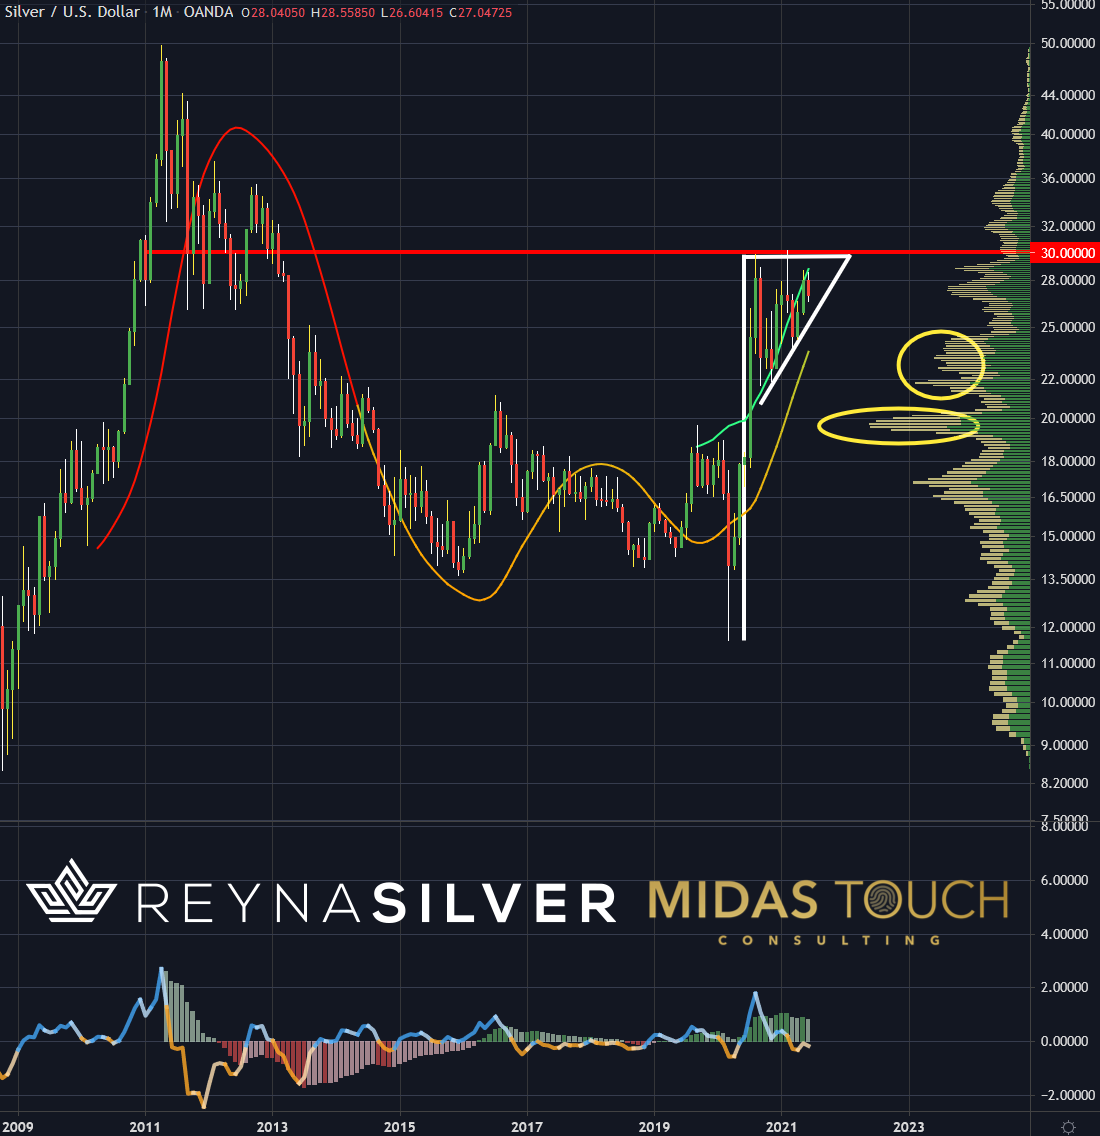
Silver in US-Dollar, Monthly Chart, Think long term:
(Click on image to enlarge)

Silver in US-Dollar, monthly chart as of June 17th, 2021.
Looking at the isolated Silver price from a long-term chart (monthly) perspective, we can clearly see the bullish consensus (bullish triangle in white lines). Moreover, the thick volume supply zone between US$22 to US$25 suggests that reaching US$20 once again has a much lower probability.
Silver with a turbo:
Your typical weekly market newsletter sounds something like: “Maybe up, but it could also be sideways and down is also an option”—a protective means never to be wrong for the author. More rarely, you will find extreme opinions which give a doomsday picture to hope five or ten years later, a market crash gets the author noticed, and if not, no one remembers what was said 5-10 years ago. Nevertheless, there are market wizards. Decades of track records supporting sound market analysis.
Stanley Druckenmiller is such a genius with 30 years in a row producing an average of more than 30% profits return per year on his client’s money. More impressively, his worst year is still a double-digit number. When we heard him recently stating that the dollar would lose within 15 years its status as a leading currency globally, the hypothesis that motivated us nearly two years ago, starting as a permabull in our publications, felt confirmed. Another turbo in play. It is these puzzle pieces more and more now coming together that support our firm belief that inter-market relationships paint a picture where Silver could become the predominant shade of a futuristic picture of wealth preservation. In this context, we are aggressive buyers here for physical Silver in this temporary price dip.
Disclaimer: All published information represents the opinion and analysis of Mr Florian Grummes & his partners, based on data available to him, at the time of writing. Mr. Grummes’s ...
more


