
Silver Breaks $100. Gold Breaks $5,000. History Breaks.

Image Source: Pixabay
Silver has crossed $100 for the first time in history. That sentence alone should tell you everything about where we are.
When I published Issue #5 of the Silver Catalyst on January 13, silver had just surged above $88 following the Department of Justice's unprecedented investigation into Fed Chair Jerome Powell. In the two weeks since, the metal tested $100 on January 23, retreated briefly, and on January 26 exploded to $117.75 intraday as gold shattered the $5,000 barrier for the first time in history.
If you positioned in silver throughout 2025, you've now witnessed a move that will be discussed in financial history books for generations. A 290%+ gain year-over-year. From $29 to $117. The gold-silver ratio has compressed from 100:1 in April 2025 to approximately 45:1 today. That compression alone represents one of the most dramatic precious metals realignments in modern markets.
The catalyst? Some of the forces identified in "Silver Rising" have not merely materialized. They have converged with an intensity that exceeded even the most bullish scenarios. China's export restrictions have fragmented global supply. COMEX inventories are hemorrhaging. Physical premiums in Shanghai reached $5-8 per ounce over Western benchmarks. The Federal Reserve's independence is under direct assault. And industrial demand from solar, EVs, AI, semiconductors, 5G infrastructure, and space technology continues consuming silver faster than miners can extract it from the earth.
This is the fifth consecutive year of structural deficits, projected to extend into a sixth. The cumulative drain has now approached 820 million ounces since 2021. The math has become destiny.
The Two Weeks That Made History
In the span of just 14 days, the silver market experienced:
- The first $100+ print in silver history (January 23)
- Gold breaking $5,000 for the first time (January 26)
- COMEX registered inventory falling to 113.27 million ounces
- The gold-silver ratio compressing to 45:1 (lowest since 2011)
- Sprott PSLV doubling its ATM program to $2 billion
- Shanghai physical premiums reaching $5-8/oz over Western benchmarks
- 44 Indian trading firms in Rajkot declaring insolvency from being caught short
The structural forces driving silver's transformation have not merely accelerated. They have reached a point where paper and physical markets can no longer maintain the pretense of unity.
There are ten Deep Dives that I'm discussing in this week's premium Silver Catalyst issue, and in this free article, I'll discuss three of them.
Deep Dive #1: COMEX Inventories in Free Fall
The Data
The January 23-26 COMEX warehouse report reveals continuing inventory stress:
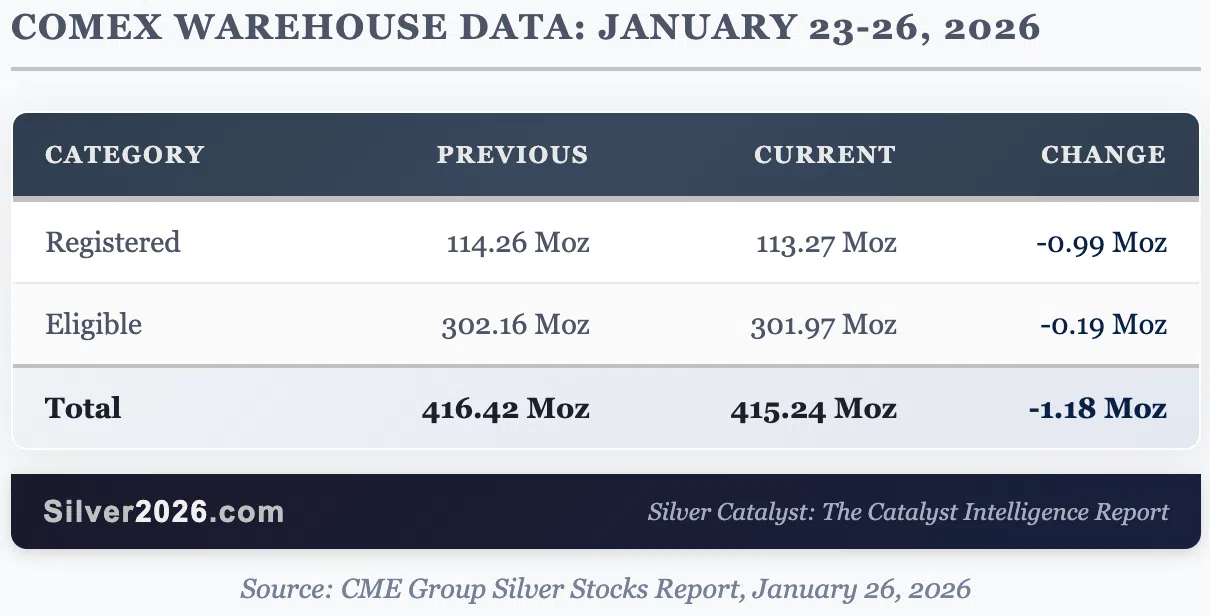
The Context
During the first week of January 2026, COMEX warehouses experienced a 33.45-million-ounce withdrawal in just seven days, representing 26% of registered inventory vanishing in a single week. January 7 data revealed JP Morgan issuing 99% of 8.1 million ounces in delivery notices through 1,624 contracts. What made this unusual? January open interest increased by 1,431 contracts despite these deliveries.
The backward rolling pattern that emerged speaks volumes about market psychology. Traders are rolling contracts from March back to January and February for immediate delivery rather than waiting. This is the opposite of normal market behavior and signals urgent demand for immediate physical metal.
The Paper-to-Physical Ratio
The paper-to-physical ratio measures how many ounces of "paper silver" (futures contracts, derivatives) exist for every ounce of physical metal available for delivery. At its historical peak, this ratio reached approximately 356:1, meaning 356 paper ounces existed for every physical ounce in registered vaults.
Today, the March 2026 futures contract alone represents 528 million ounces of exposure (105,683 contracts × 5,000 oz) against only 113 million ounces of registered silver. That is more than 4x the deliverable supply concentrated in a single contract month.
Catalyst Connection: This validates Catalyst #2: COMEX Inventory Depletion Creating Delivery Crisis from "Silver Rising." The ratios have now deteriorated far beyond what I described when writing the book.
Deep Dive #3: The Stanford Breakthrough That Could Transform Silver's Future
What Happened
In Issue #4 (this issue is available free), I discussed Samsung's solid-state battery program and its potential implications for silver demand. The Stanford research published January 16 in Nature Materials takes this story significantly further.
Stanford researchers demonstrated that a nanoscale silver coating can solve the cracking problem that has plagued solid-state batteries. Silver-treated solid electrolyte surfaces become 5x more resistant to lithium intrusion damage, achieved by heat-treating a mere 3-nanometer silver layer that allows silver ions to replace lithium atoms 20-50 nanometers below the surface.
Why This Matters
Current lithium-ion EVs use 25-50 grams of silver per vehicle. Industry estimates suggest Samsung's solid-state batteries could require approximately 1 kilogram of silver per 100 kWh battery pack, based on ~5 grams per cell across ~200 cells per pack. Samsung's solid-state battery program uses a silver-carbon (Ag-C) composite anode promising 600-mile range and 9-minute 80% charging. BMW is partnering with Samsung for next-generation evaluation vehicles in late 2026.
Sources: Batteries News, Discovery Alert
The Demand Math
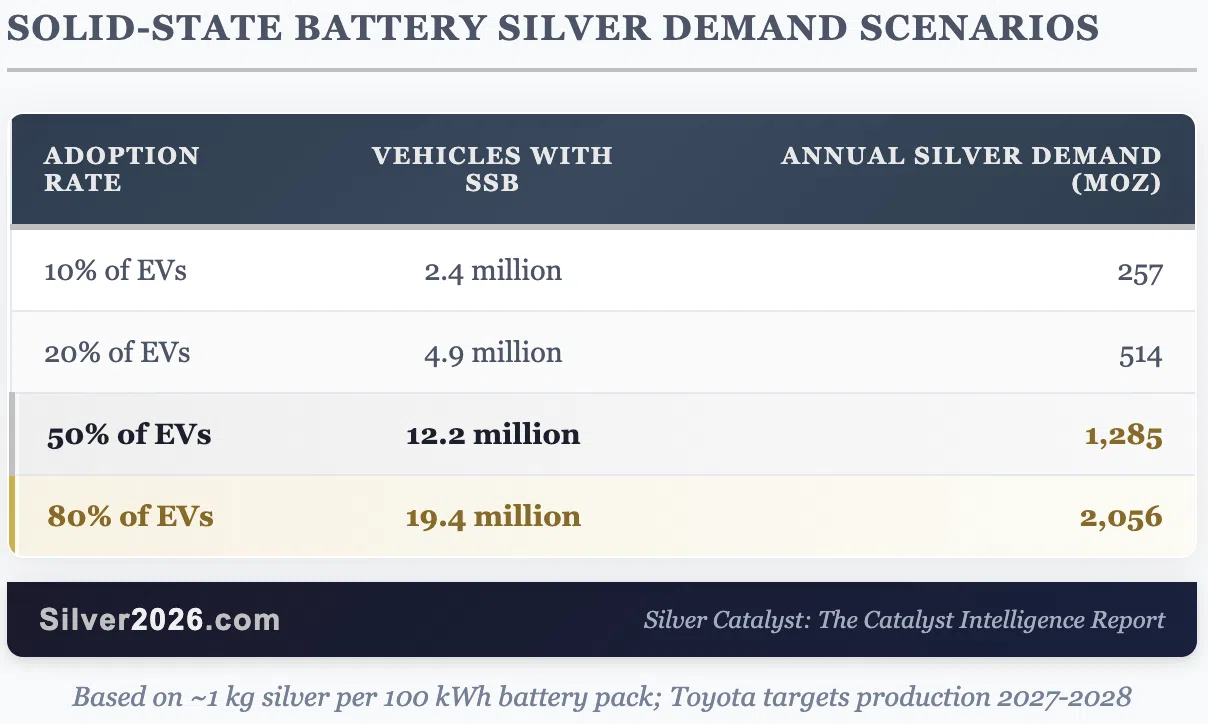
At 50% solid-state battery adoption, automotive silver demand alone would exceed current total industrial demand. This is a potential order-of-magnitude transformation in the demand picture. The timeline remains uncertain (Toyota targets production 2027-2028), but the directional implications are extraordinary.
Why does it matter? If solid-state batteries achieve even 20% EV market penetration by 2030, that's 514 million ounces of new annual demand, roughly equal to the current annual industrial consumption. This isn't a marginal increase. It's a potential doubling of industrial silver demand from a single application. The Stanford research moves this from "interesting lab concept" to "engineering problem being solved."
Catalyst Connection: This validates Catalyst #80: Solid-State Batteries Requiring Enhanced Silver Content from "Silver Rising."
Deep Dive #9: Sprott Doubles Down with $2 Billion
The Announcement
On January 20, 2026, Sprott Physical Silver Trust (PSLV) announced it had updated its at-the-market equity program to issue up to $2.0 billion of units, doubled from the $1 billion announced December 11, 2025. Proceeds will fund physical silver bullion acquisition.
Source: Sprott Press Release, January 20, 2026
What This Signals
At current silver prices (~$110/oz), $2 billion could acquire approximately 18 million ounces of physical silver. This represents roughly 16% of current COMEX registered inventory. Sprott is effectively signaling that institutional demand for allocated physical silver justifies this scale of capital deployment.
ETF Flow Summary
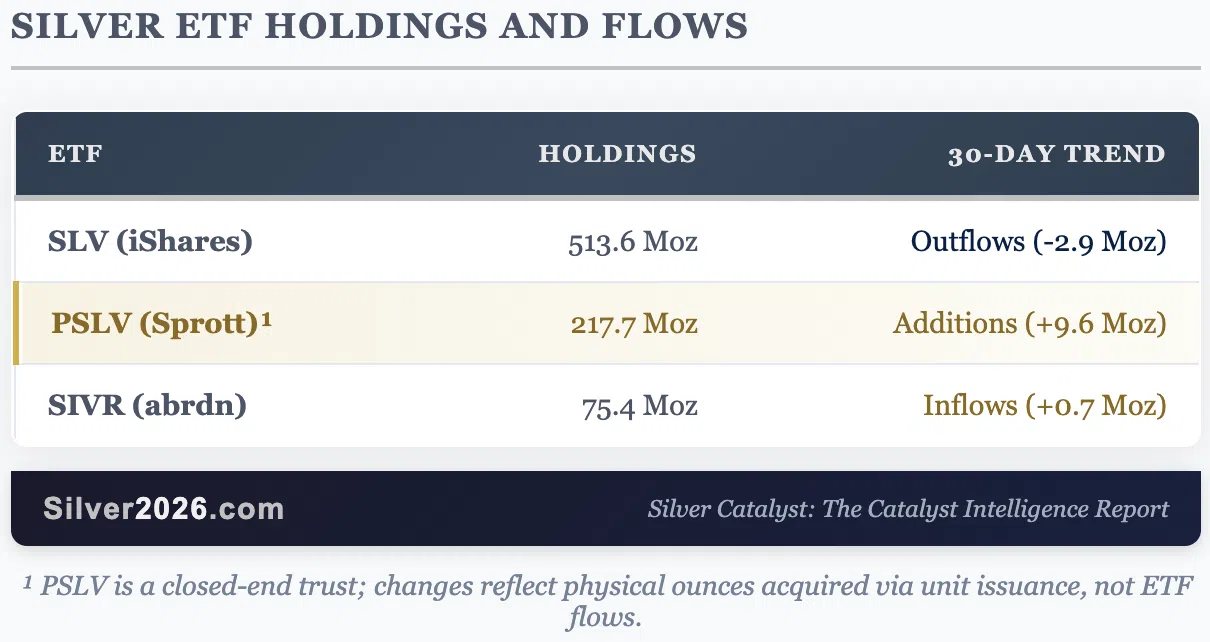
The divergence is notable: SLV experienced profit-taking outflows while PSLV and SIVR attracted capital. This may reflect investor preference for funds perceived to have more direct physical backing.
Why does it matter? Sprott doubling its capital raise capacity to $2 billion signals institutional conviction about physical silver's value proposition. At ~$110/oz, that's approximately 18 million ounces of buying power, equivalent to 16% of COMEX registered inventory. When institutions compete for physical metal at this scale, they're betting that paper claims will continue losing credibility relative to allocated bullion. The divergence between SLV outflows and PSLV/SIVR inflows suggests sophisticated investors are distinguishing between types of silver exposure.
Catalyst Connection: This validates Catalyst #52: SLV Inflows Exceed $2.5 Billion as Regional Divergence Became Global Convergence from "Silver Rising." The ETF story has evolved from regional divergence to coordinated global accumulation.
The Outlook
Silver has almost reached my $120 target from Issue #5, with the January 26 intraday high of $117.75. After a move of this magnitude, a decline or consolidation would be normal and healthy. Markets don't move in straight lines, and profit-taking after a 290%+ year is to be expected.
That said, the fundamental picture remains exceptional. The structural deficit continues into its fifth year. China's export restrictions took effect January 1 and have not been reversed. COMEX inventories keep falling. Physical premiums in Asia remain elevated. The Fed independence crisis creates ongoing monetary uncertainty. And the industrial demand story, from solar to EVs to AI to solid-state batteries, keeps strengthening.
This is a once-in-a-generation opportunity in the silver market. The convergence of supply constraints, industrial demand growth, and monetary instability that I outlined in "Silver Rising" is playing out faster and more intensely than even the bullish scenarios suggested. The full Issue #6 contains seven more Deep Dives covering solar thrifting, the physical market fracture, India's demand surge, semiconductor capex, 5G infrastructure, space technology, and the Fed crisis, plus the complete Catalyst Dashboard and institutional price forecasts. If you want to understand where this market is headed and stay informed as it unfolds, I encourage you to get "Silver Rising" with complimentary 2-week access to the Silver Catalyst newsletter.
More By This Author:
So, It’s $120 For Silver After All
$100 Silver Finally Congratulations!
Will The Greenland Threat Push Silver To $120?


