
Silver Appears Overbought, But Long-Term Outlook Good
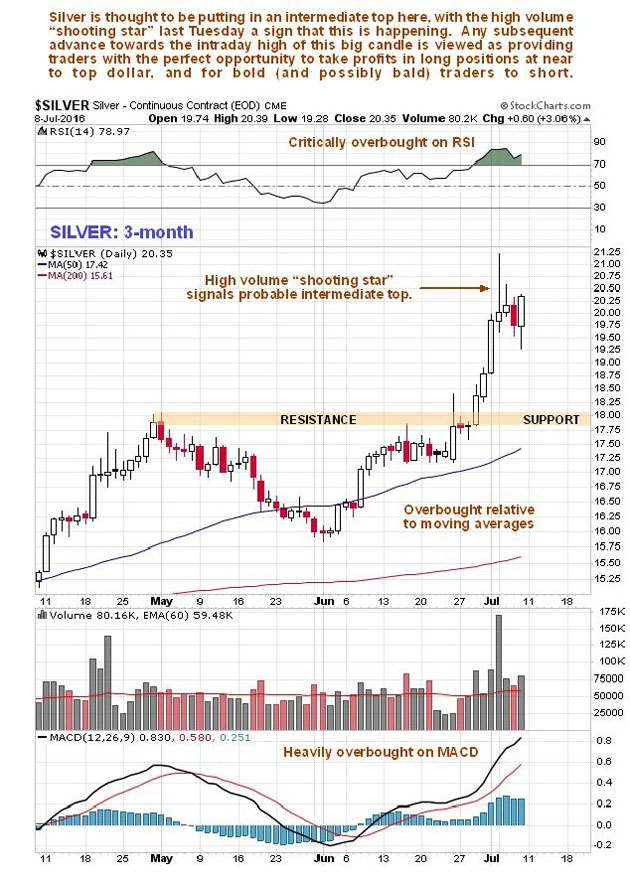
On its short-term 3-month chart (below), we can see that, after rising sharply late last month, a sizeable bearish "shooting star" appeared on the chart on heavy turnover at the start of this month, at a time when silver was critically overbought, which indicates a high probability that silver will react back soon.
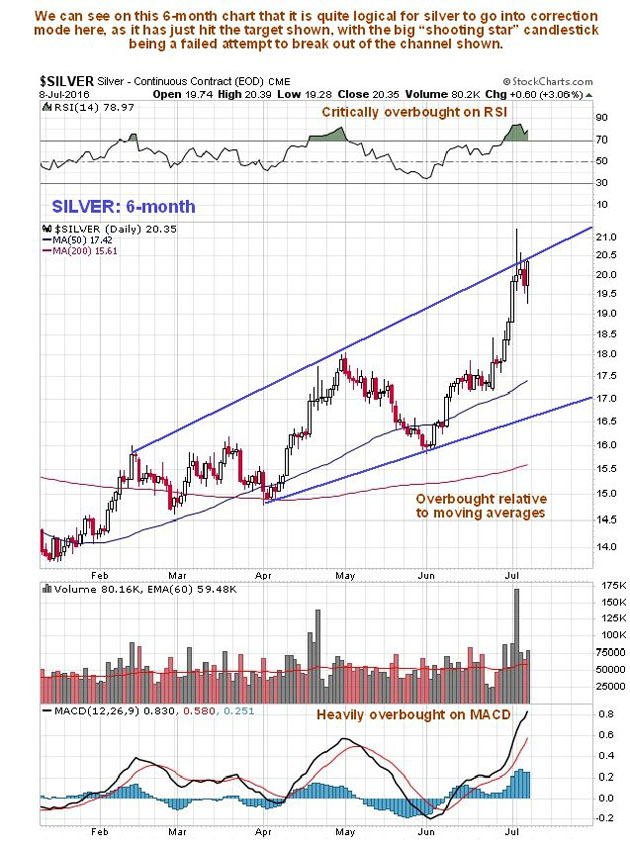
On the 6-month chart we can see why silver might react back here—it has just arrived at the top of an expanding uptrend channel in a very overbought state. Thus, a reaction back looks likely, and this would be a healthy development that sets it up for the next up-leg. Given the current COT structure it would not be unreasonable for it to drop back to the support shown in the $18 area over the short- to medium term.
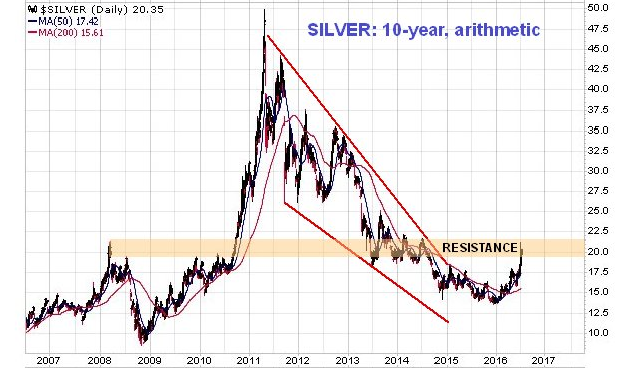
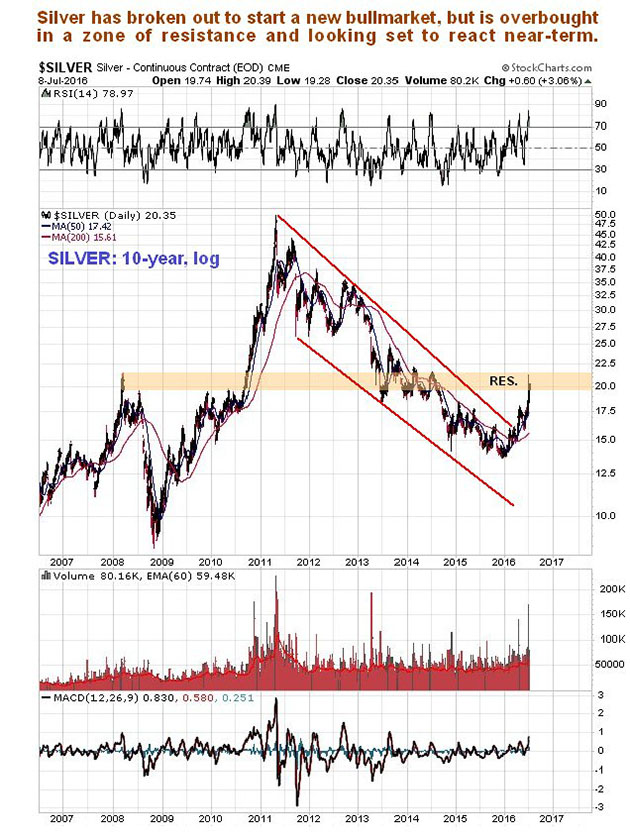
The long-term 10-year arithmetic chart gives us a much broader perspective. This is actually a very positive chart overall, for as we can see silver's bear market phase from 2011 has definitely ended. However, it has risen quite sharply in recent months to arrive at a zone of significant resistance, so it would be quite normal for it to consolidate or react back here, before breaking above this resistance and continuing higher.
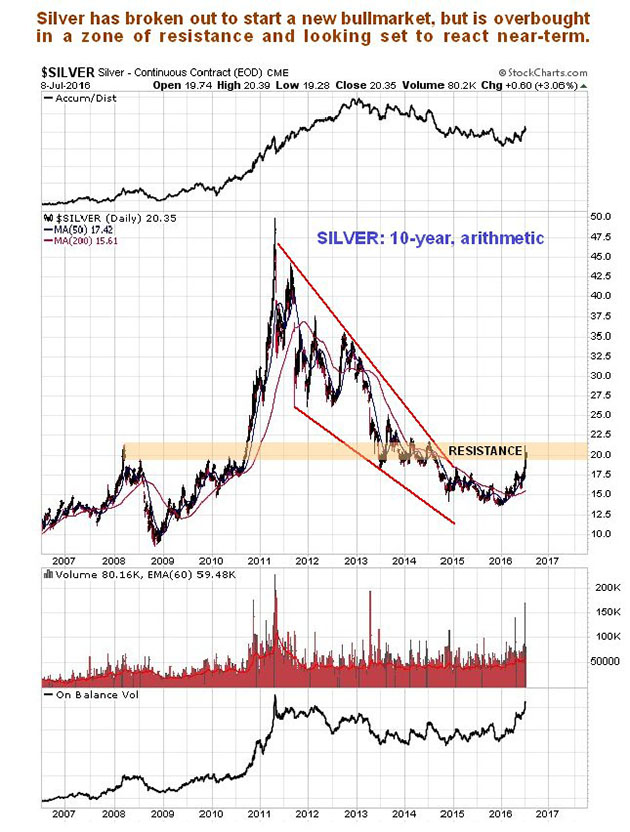
Silver has also broken out to start a new bull market on its 10-year log chart. . .
As with gold, Commercial short and Large Spec long positions in silver have built up to a very high record level, making a reaction back soon a high probability. . .
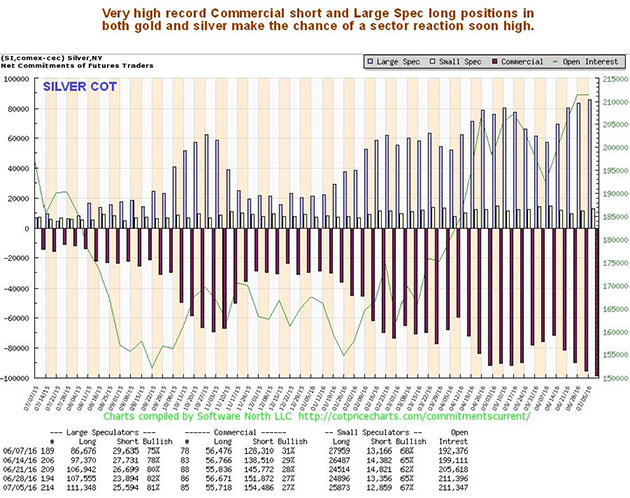
The COT chart shown above, which only goes back a year, probably doesn't drive home just how extreme the current situation is. If not, then the following chart should get the job done. The long-term Hedgers chart shown below, which is a form of COT chart, shows that Hedgers positions are now at frightening bearish extremes. When the reading reaches the red dotted line it is at a normal bearish extreme, which often, but not always, leads to a drop in the silver price. When the reading is way below it, as now to an unprecedented extent, the situation is critical, and please note that I didn't create this chart, sentimentrader did, and they are not known for being anything other than totally objective.
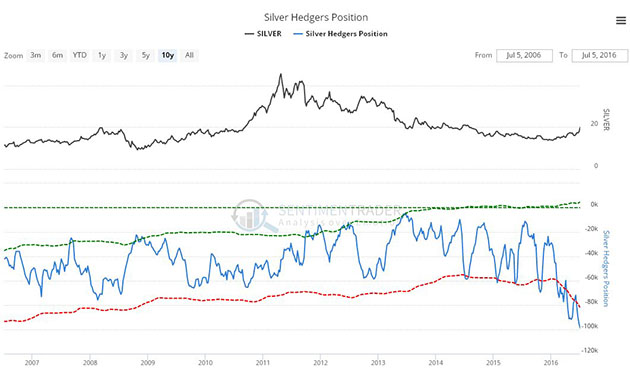
Chart courtesy of www.sentimentrader.com
The silver optix or optimism chart shows that bullishness towards silver is now at extreme levels, and while this doesn't always lead to an immediate reversal, taken together with the other factors that we have observed, it does suggest that caution is in order with respect to silver's immediate prospects.
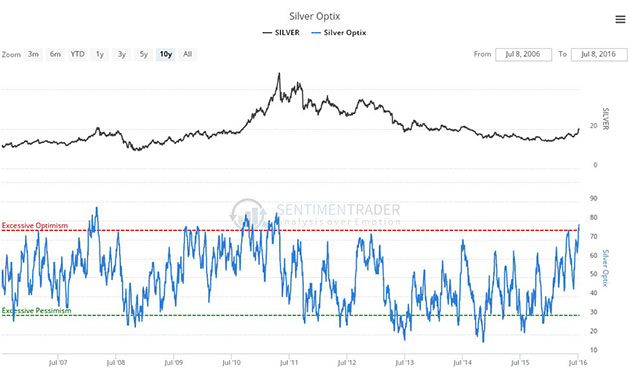
Chart courtesy of www.sentimentrader.com
Your reaction to all this depends first of all in whether you follow the logic of it and agree with it or not, and second on what sort of investor or trader you are. If you are a long-term investor, you may simply decide to ride out any correction, but if on the other hand you are aggressive trader, you may want to cash in longs and even consider opening some shorts in the sector, but, whichever, it still looks like a good idea to take some money off the table here if you are long the sector, taking advantage of the comparatively high prices now prevailing.
Disclosure:
more


