Silver : The December Battle
As soon as a chart appears, some people close like an oyster, without trying to grasp its meaning. However, once you understand the basics, such as the simple principle that B + A = BA, it becomes not only accessible, but also fun.
To better illustrate, let's take the example of a daily candle.
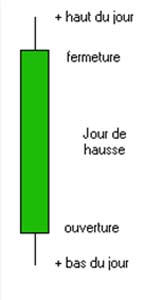
A green candle indicates that, at the close of the market, the price was higher than the opening. The part colored in green is the body of the candle. The thin black lines located above or below the body are called wicks.
The lower wick indicates that the price has fallen below the opening level for the day, while the upper wick indicates that the price has risen above the closing level for the day:
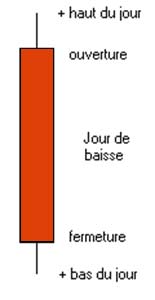
A red candle indicates that the market closed below its opening price:
Prices can be analyzed on different time frames: one minute, one hour, one day, one week, one month, one quarter or even one year.
The general principle stated above remains the same.
All this to help you understand this silver chart in annual time frame, where each candle represents one year.
Looking at the year 1979, you will notice that the candle is green. The close was at the high of that year, below $31.
In 1980, the year started significantly higher than the December 1979 close, continuing its rise before falling and ending well below the opening level. So, despite silver's intraday record of $49.95, the 1980 annual candle is red:
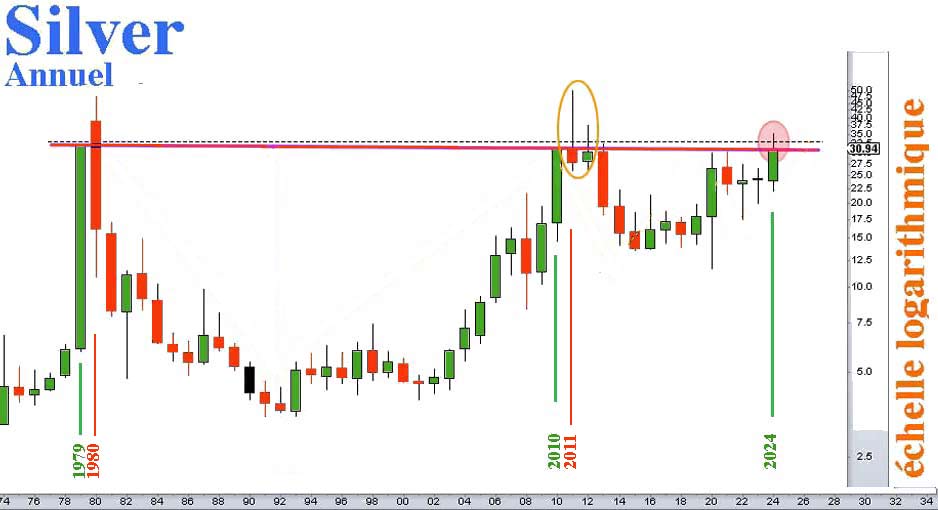
In 2010, the candle was extremely bullish. It is green, and the close was at the high of the year, at $31.
In 2011, silver peaked at around $49.7 in April, but ended the year below the opening level, below $31. Thus, the candle is red.
2012 is green. Prices went above $31, but once again, the bullion banks maneuvered to end the year below this resistance.
The battle of december 2024
Currently, the silver's annual candle is green. Over the past six months, silver prices have recorded six peaks above the $31 resistance.
Now, look at the monthly silver chart, where each candle represents a month.
We can see that since May, almost all candles have been above the resistance, as shown by the high wicks. The September close was above the resistance at $31.16. In October, the body of the candle remained entirely above $31.
To confirm that the resistance has been broken and has become true support, two closes above it are required. This is now the case!
In November, the body of the candle had been almost entirely above the resistance, with the close just below it.
From a chartist perspective, November was just a pull-back on the former resistance.
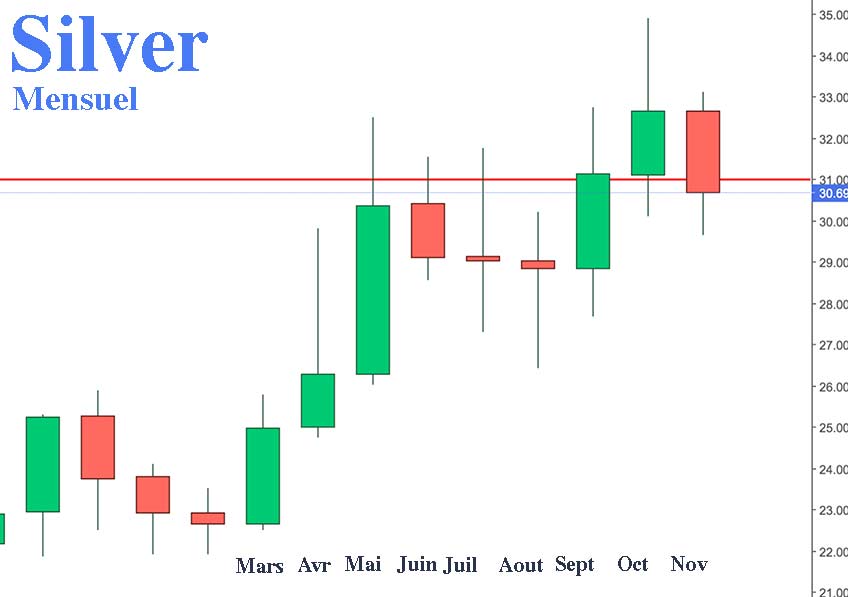
December must close above this resistance, which has been blocking prices since 1979! This represents 45 years of price control by the bullion banks Cartel.
The 21 may 1982, the head of the Ministry of Machinery Industry at the People's Bank of China declared:
"The world's identified silver mineral resources are only sufficient to exploit the ore for 42 years. The silver shortage will become a persistent world problem."
China rules the game
Remember that in 2009, China encouraged its citizens to invest in precious metals.
Since then, the Chinese central bank, by manipulating its currency against the dollar, has ensured that gold in yuan never falls below the 2009 level:
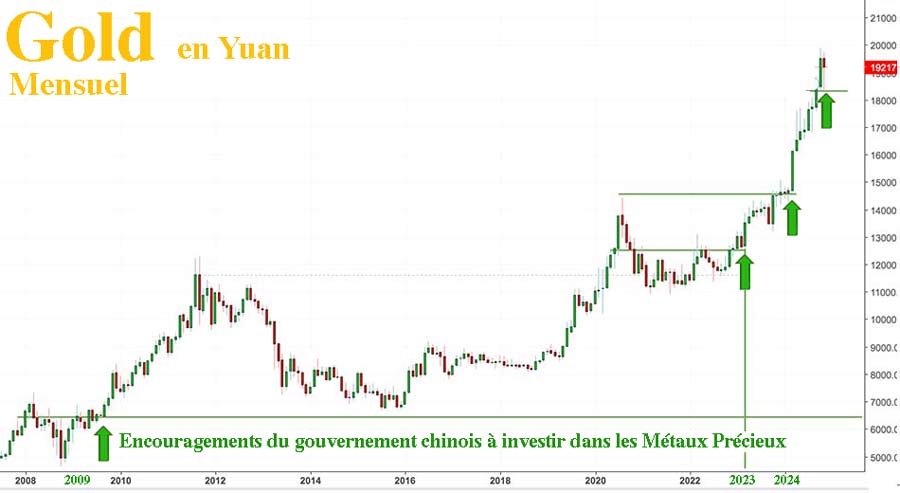
In 2023, China encouraged its citizens to invest in various ways, including through central bank-backed metal accounts and ETFs.
In March 2024, a new government initiative caused gold and silver prices to rise sharply.
We saw the impact of these 2023 and 2024 decisions in the London and New York markets, where all central banks had to align with Chinese prices, forcing the Cartel to raise all their positions.
In November 2024, the rules of the Shanghai market were relaxed, allowing 55 million Chinese small and medium-sized enterprises, representing 60% of the country’s GDP, 70% of technological innovation, and 80% of urban employment, to invest directly in precious metals.
These new rules allow for smaller quantities of gold or silver to be purchased, making contracts more accessible to the 55 million companies. We should see a further increase in Chinese demand, which will put upward pressure on the price of the metal.
According to all of Andrew Maguire’s suppliers in Asia, gold will be forced to rise to $3,000 by the end of Q1 2025… and silver will reach new all-time highs.
Gold has definitely broken its 2011 all-time high of $1,900 in November 2023. As for silver, it should have broken $49 a year ago.
Silver is woefully behind gold.
Its price is expected to see a meteoric rise in Q1.
More By This Author:
The Case For Gold Is IncontrovertibleEurope Sinks Into Crisis
Trump: The American Economy On Trial
Disclosure: GoldBroker.com, all rights reserved.


