
Friday’s analysis took a rather extensive form, so now I’ll briefly introduce today’s technical part.
Practically everything that I wrote about the medium-term (bearish) outlook for the precious metals sector remains up-to-date. Only the short-term situation was somewhat unclear.
Given Friday’s movement and today’s pre-market trading, the situation has been clarified. Of course, it doesn’t mean that what I’m going to describe is bound to happen, but it does mean that a certain near-term outcome just became more likely.
Let’s take a closer look at the charts for details.
(Click on image to enlarge)
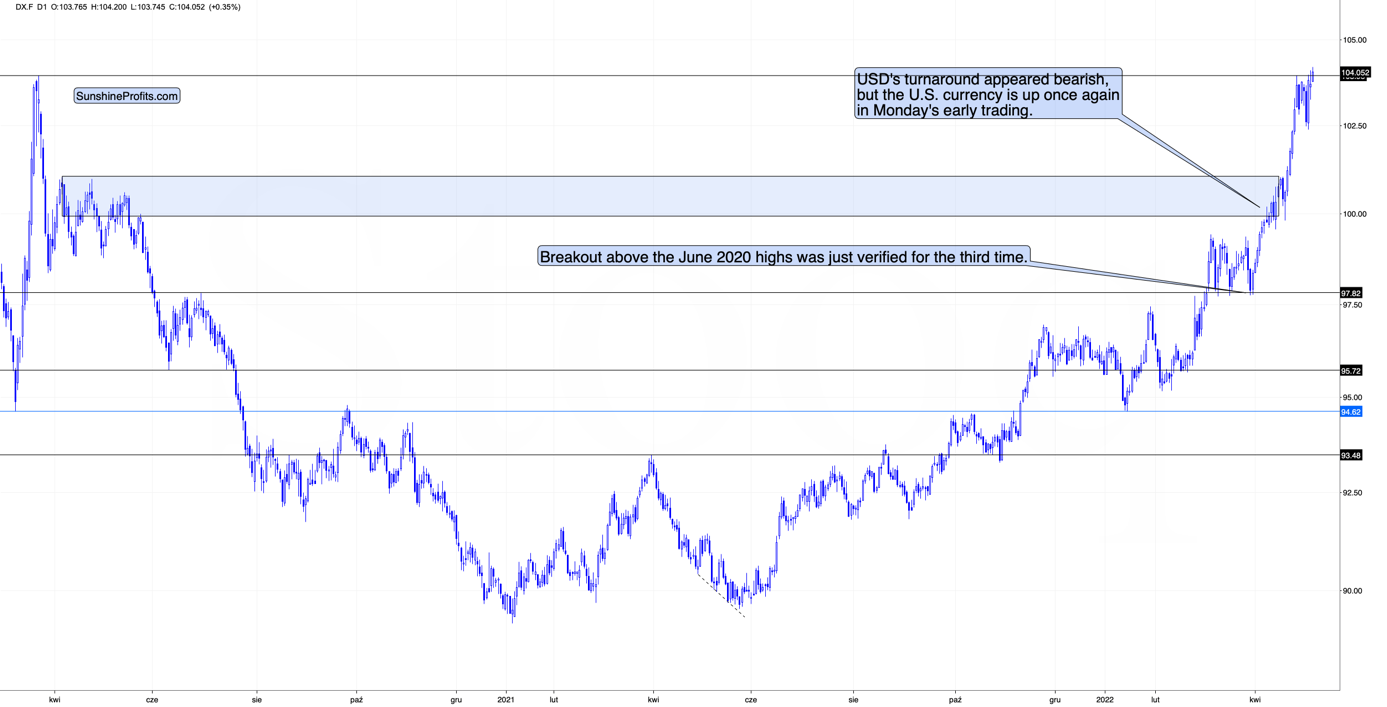
As you can see above, the USD Index just moved above its 2020 high and above its recent highs. This is a major breakout. However, given how the USD Index performed after a similar breakout (in 2014), it seems that we might see a corrective move soon (perhaps after an additional rally). I previously described it in the following way:
(Click on image to enlarge)
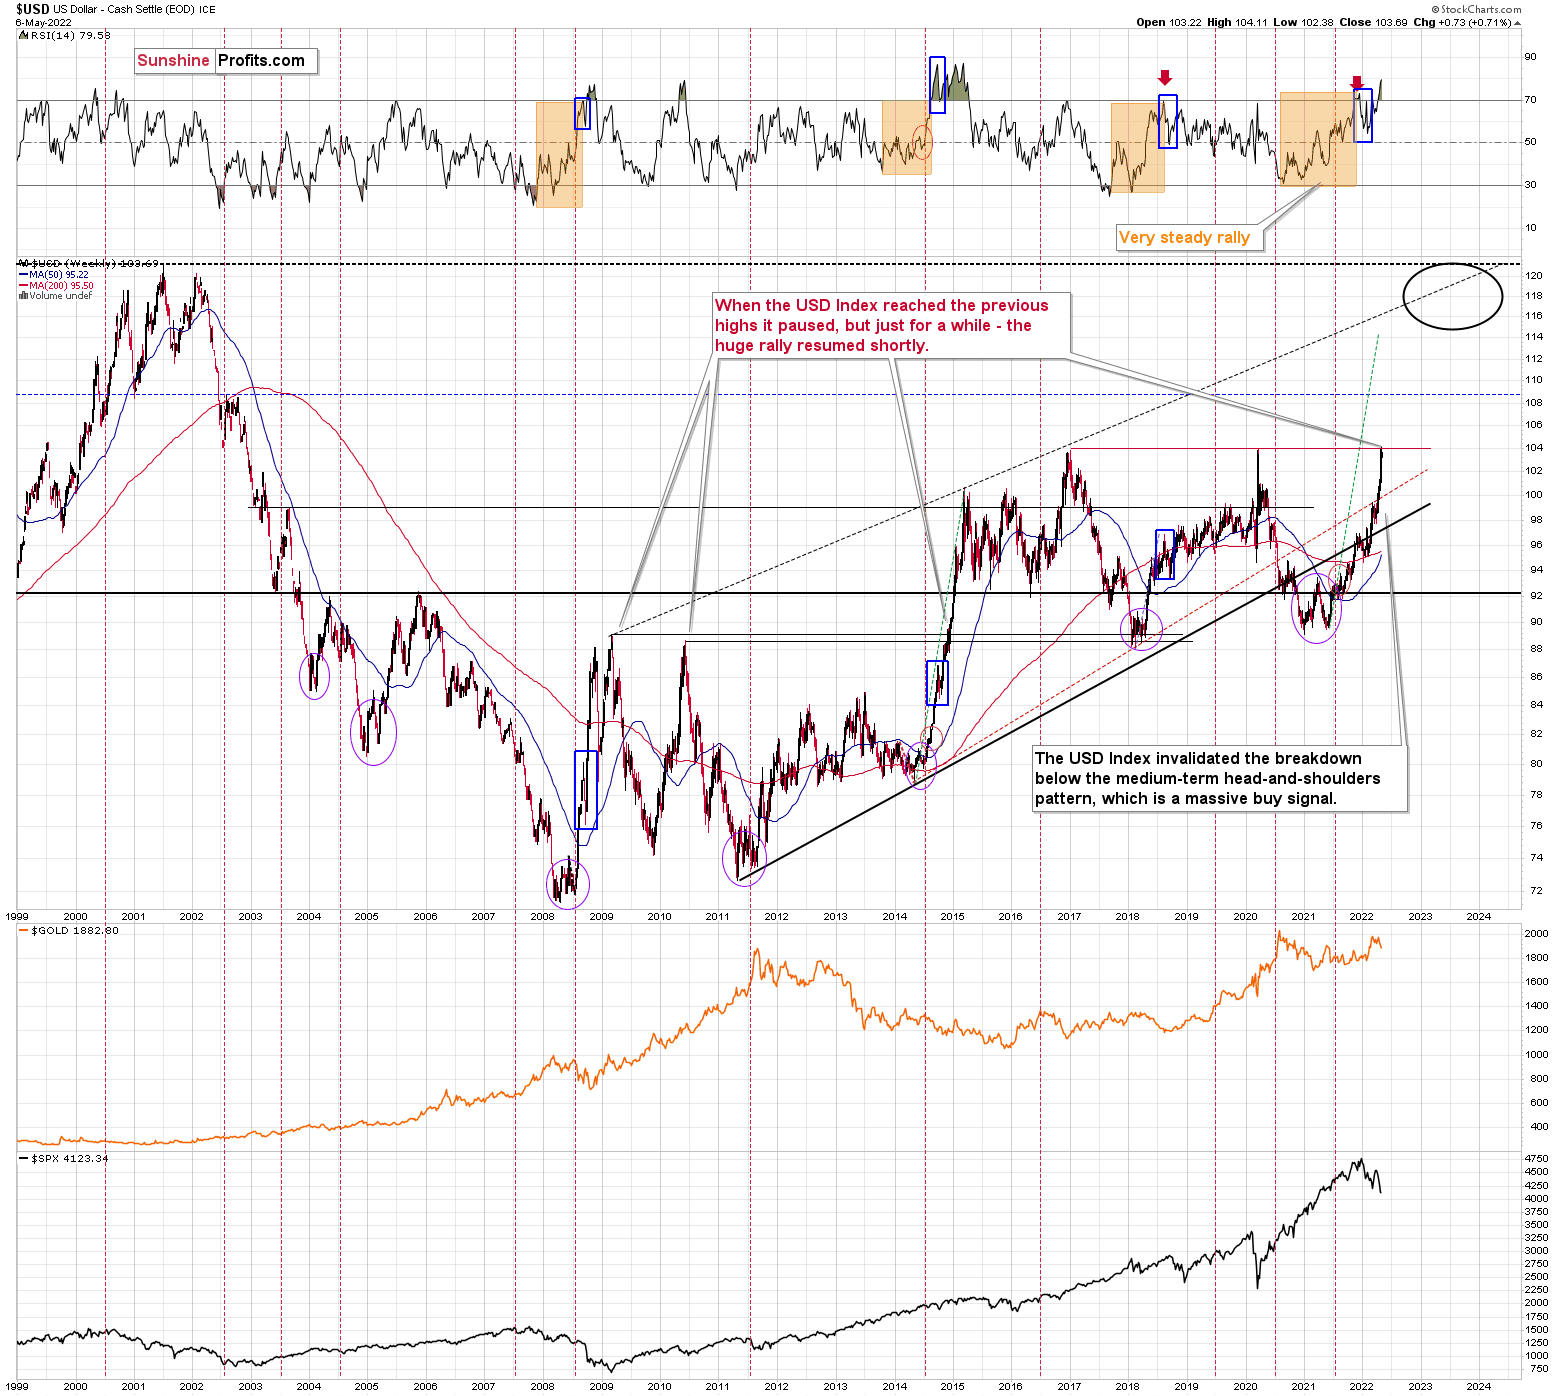
I would like to add one important detail. Back in 2014, the USD Index didn’t correct after reaching its previous high. It corrected after moving above it. The higher of the highs was the March 2009 high, at 89.11.
The higher of the recent highs is at 103.96 right now, so if the analogy to 2014 is to remain intact, the USD Index could now top at close to 104.5 or even 105.
So far, today’s pre-market high is 104.2, so the USDX could still move higher before correcting.
The important detail about today’s early trading is that while the USD Index moved above its recent highs, gold didn’t move below its recent lows.
(Click on image to enlarge)
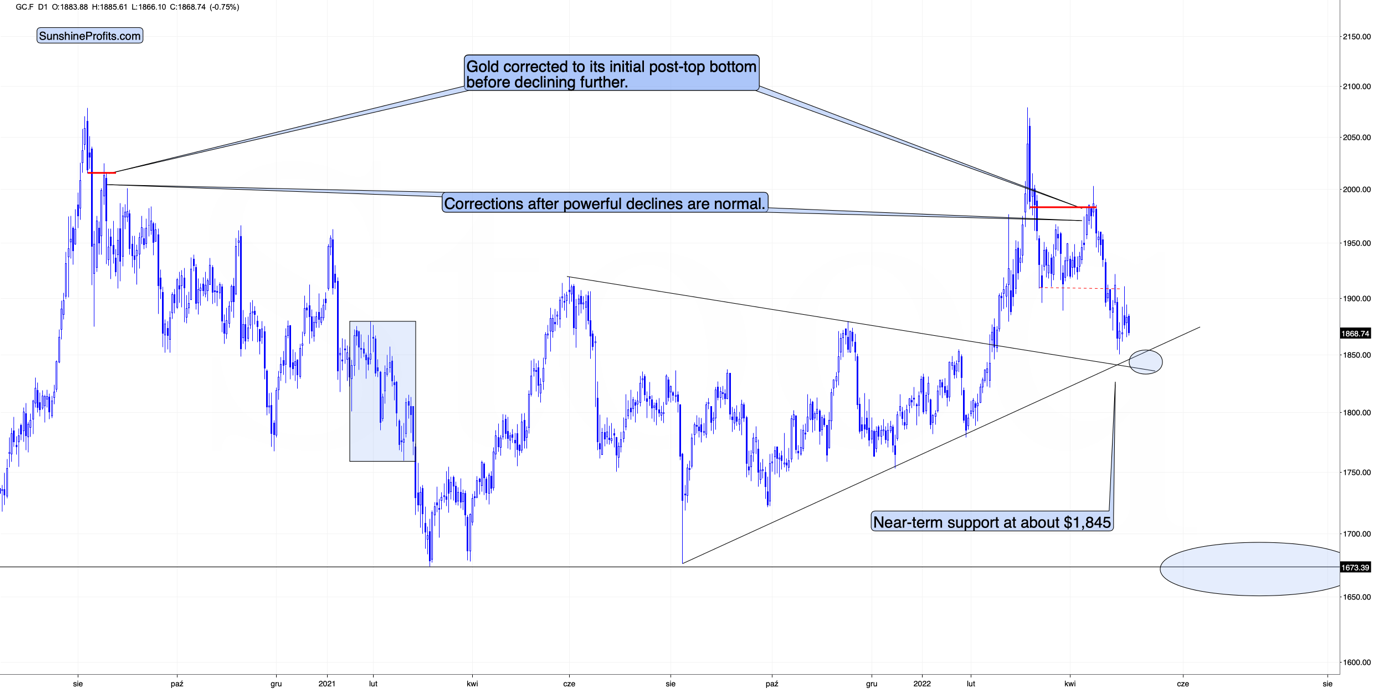
It remains above the recent highs and not that far from its downside target area, provided by the rising and declining support lines, as well as by the very recent lows.
From gold’s perspective, the short-term (!) downside appears limited.
From USD’s perspective, the short-term (!) upside appears limited.
We see that gold is acting relatively strong today given what’s happening in the USDX. This is a bullish combination for the short term and suggests that a short-term bottom in gold is near. Of course, the medium-term trend remains bearish nonetheless.
Interestingly, while gold didn’t move to new short-term lows, silver and junior mining stocks did.
(Click on image to enlarge)
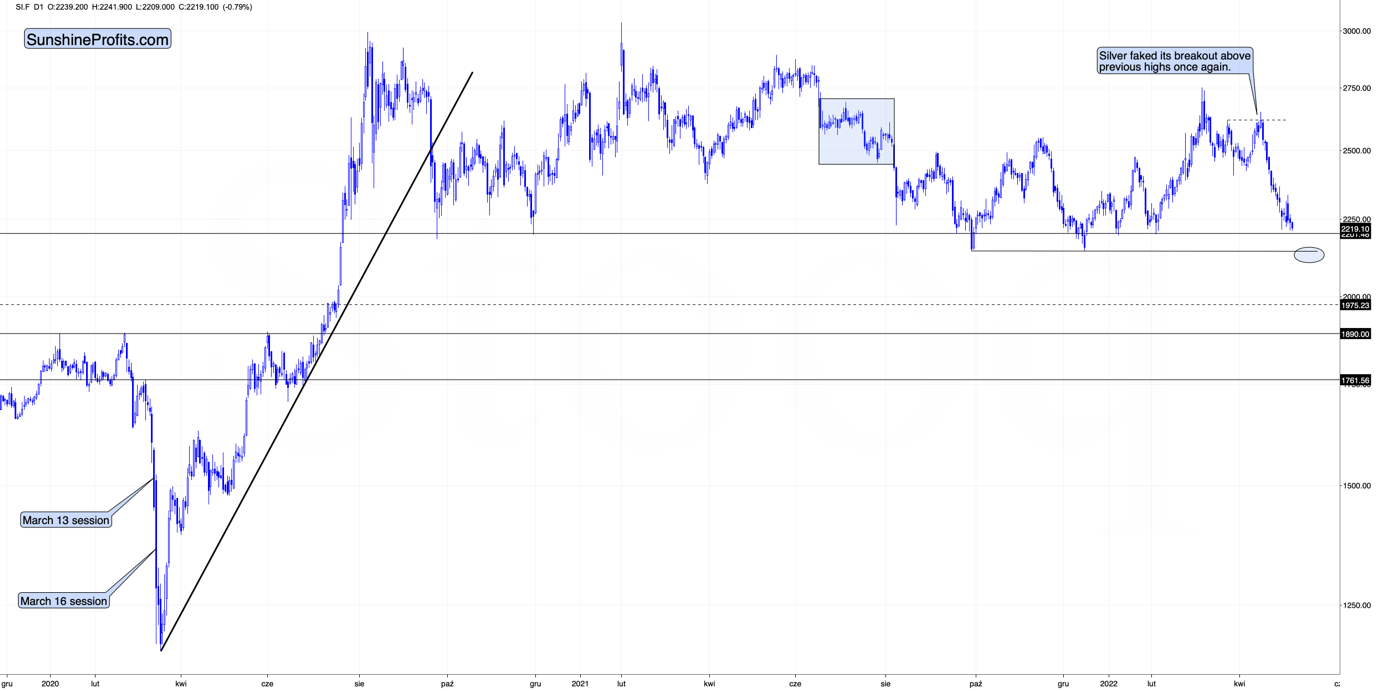
Silver moved just slightly lower, but that was enough for it to move below the previous local lows.
The support provided by the recent lows is quite close (marked with a blue ellipse), but silver is not there yet.
Here’s what the GDXJ ETF is doing in today’s London trading.
(Click on image to enlarge)
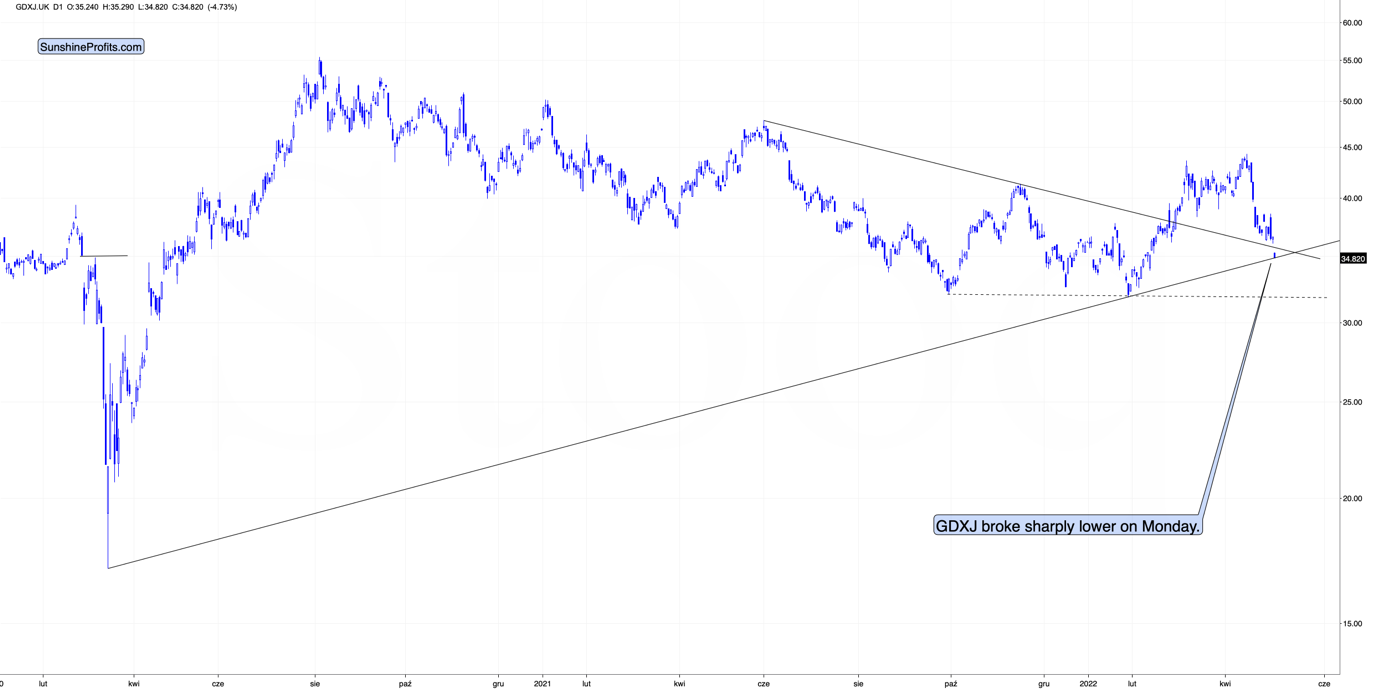
It declined sharply and moved to the rising support line based on the 2020 and 2022 lows. This level is what I described (on the analogous version of the above chart, based on the prices from the U.S.) as something that could stop the current short-term decline.
So, will the GDXJ bottom today or is it bottoming (from the European point of view) right now?
To better answer that question, let’s take a look at the likely reason for today’s silver and miners’ weakness – the general stock market.
Before moving to the overnight changes, let’s recall what I wrote about stocks on Friday:
(Click on image to enlarge)
After the immediate “phew-its-not-a-0.75-rate-hike rally”, we saw a “hold-up-rates-are-still-soaring-aaah-decline”. Is the relief rally already over?
That, ladies and gentlemen, is the key question right now.
It could be the case that one rally is over, but it doesn’t mean that another one couldn’t start from just slightly lower levels.
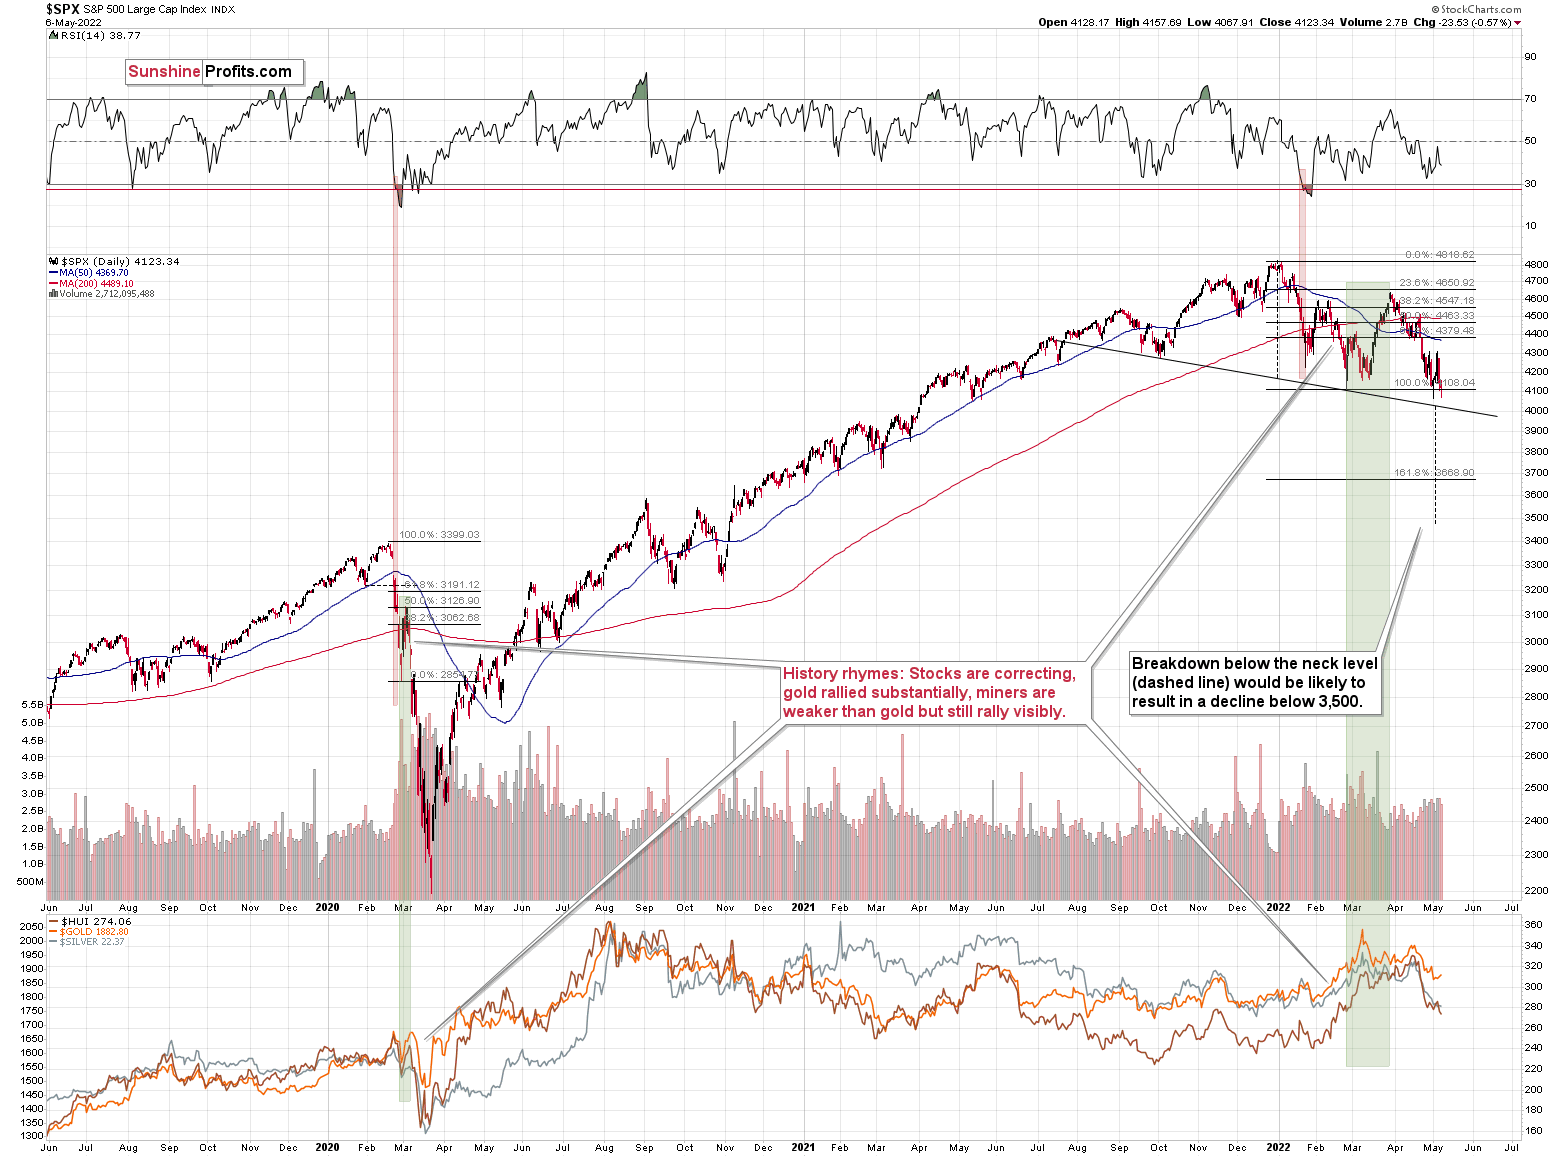
The S&P 500 is currently forming a (potential so far) head and shoulders pattern, and once it moves below its neck level (slightly above 4,000), the formation will be complete, and the next target will be below 3,500. So, yes, I expect the S&P 500 to decline below its 2021 lows in the near future.
Still, it doesn’t mean that we can’t get another brief rally in the meantime. In fact, the head and shoulders formations are often immediately followed by a brief corrective upswing – one that takes the market close to or right back to the previously broken neck level of the H&S pattern. Seeing this kind of rally would perfectly correspond to the scenario in which S&P rallies when the RSI indicator moves to 30, and it would perfectly match other potential price moves that I mentioned earlier today.
In other words, if stocks decline somewhat and then correct, it could translate into the same thing in gold, silver, and mining stocks. Given the stronger link between stocks and silver and miners duo, the latter could correct more visibly.
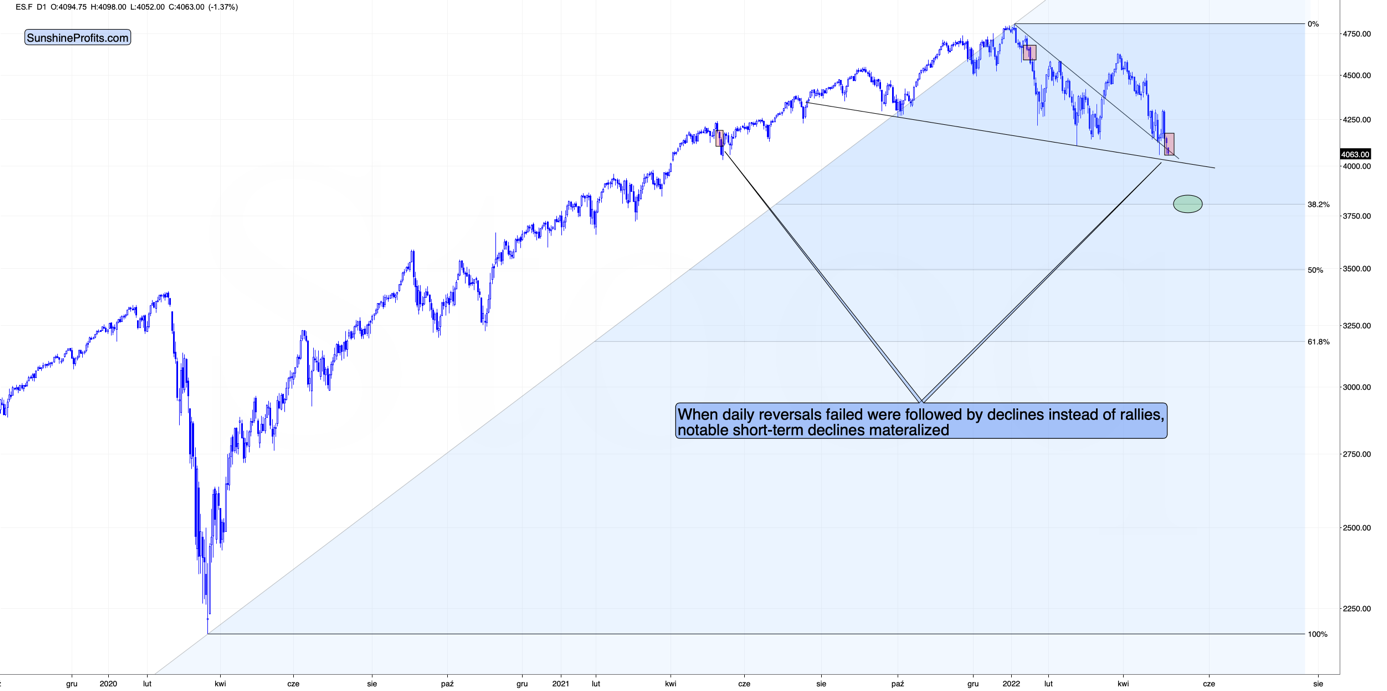
The chart below features the S&P 500 futures chart.
(Click on image to enlarge)
On Friday, the S&P 500 had its lowest daily close of the year. While investors might not see many technical patterns, they’ll definitely notice something like that. That’s bearish – it could trigger some panic selling among investors, and today’s pre-market decline indicates that it might already be taking place.
Interestingly, Friday’s session was a daily reversal, so it seems that stocks should be rallying today, but… they are not. Technically, it’s the futures market that shows declines, not the index itself, but futures can be used as the index’s proxy here.
That’s where the situation gets really interesting. There were very few cases when a daily reversal was followed by a decline below the reversal’s low. In fact, in the recent past, there were just two such cases, and I marked them with red rectangles. In both cases, short-term declines followed. What’s notable is that this was the way in which the January decline started, and the decline that followed was sizable.
if stocks are about to decline (continuing their pre-market decline), then they would do so after a consolidation that took the form of a flag. Thus, the price would be likely to fall by about the same amount as it had fallen before the pattern. One could argue when the previous short-term decline started (at the recent top or at the very recent top before the decline accelerated), but overall, it seems that stocks would be likely to decline below the neck level of their head and shoulders formation, and then decline some more.
Is there any nearby support level that would be strong enough to stop this short-term decline? Yes: it’s the 38.2% Fibonacci retracement level based on the 2020-2022 rally.
Back in 2020, the very first decline erased 50% of the preceding rally, but back then the market was much more volatile than it is right now, so it’s understandable.
If we see a decline to the 38.2% Fibonacci retracement and then a comeback to the previously broken neck level of the head and shoulders pattern, it would fit practically everything that I wrote above.
It would trigger a sizable decline in junior mining stocks in the near term.
If so, then it’s unlikely that junior miners are bottoming right now, as one might expect based on the chart that I featured earlier today. Instead, it seems that the GDXJ might indeed have managed to decline to its previous 2022 lows and then correct sharply from there.
In order for gold to reach its target, it only needs to decline by as much as it has already declined today.
However, in order for the general stock market to reach its downside target, it would need to decline several times as much as it has already declined today.
In today’s pre-market trading, junior miners are taking the stock market’s bearish lead. Consequently, they could decline much more than just as much as they already have today.
Therefore, the scenario in which junior miners move to their previous lows before bouncing is currently the most important one, in my opinion. Consequently, I’m lowering the exit prices for the current short position, in order to capitalize on a bigger move lower.


Comments
Log in or sign up to join the conversation.