
Searching For Meaning In Gold’s Scorching Rally - Part 2

Image Source: Pexels
<< Read More: Searching For Meaning In Gold’s Scorching Rally - Part 1
Below are some of the most interesting things I came across this week.
LINK
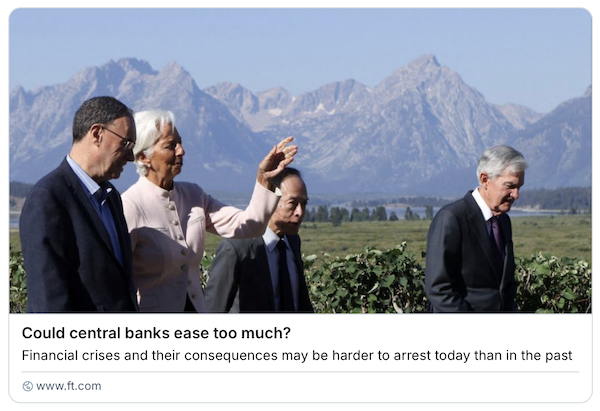
Raghuram Rajan writes, “US financial conditions have eased throughout the Fed’s tightening phase. This suggests the excesses have not been squeezed out of the system, and will only grow again from a high level as monetary accommodation increases.”
CHART
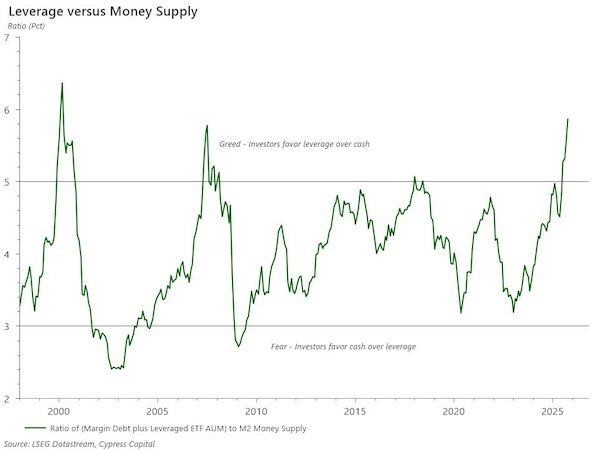
From the looks of leverage being employed in the markets, it’s certainly hard to argue any excesses at all have been addressed by the central bank. As Mark Dodson points out, “the ratio of margin debt to money supply is higher than at any time except February and March 2000,” which was the peak of the dotcom bubble.
LINK
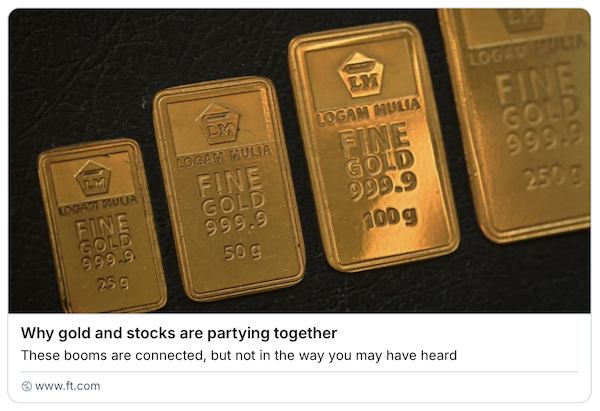
Not only are stocks partying like it’s 1999, as Ruchir Sharma notes, gold is partying like it’s 1979. “Historically, the correlation between them was zero. In the gold rush of the 1970s, stocks were dead in the water; in the stock boom of the 1990s, gold prices were falling. Now they’re rising together on a tide of liquidity,” he explains.
CHART
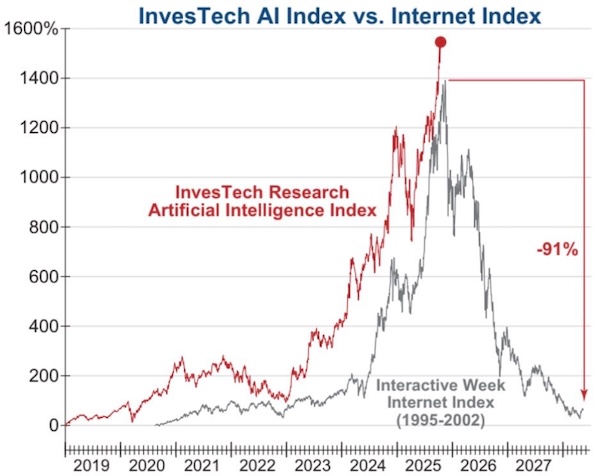
This tide of liquidity may be fueling another bubble. “The Investech AI Index has been riding a wave of ‘stock hyping’ announcements. However, these deal announcements boil down to something far less attractive and reminiscent of past bubbles: insidious vendor financing, circular money flows and leveraged debt accumulation,” reports Investech Research.
LINK
The problem, as Gita Gopinath writes, is that, “A market correction of the same magnitude as the dotcom crash could wipe out over $20T in wealth for American households, equivalent to roughly 70% of American GDP in 2024. This is several times larger than the losses incurred during the crash of the early 2000s.”
More By This Author:
Searching For Meaning In Gold’s Scorching Rally - Part 1
America Is Now One Big Bet On AI
How Do You Measure A Bubble?


