
Image Source: Pixabay
In 2025, silver recorded its best performance since 1979, significantly outperforming gold and most other asset classes. With an increase of nearly +150%, the grey metal made its most spectacular comeback since the 1970s. The decline in demand for physical silver was more than offset by strong growth in investment demand, while silver production is struggling to grow amid a persistent structural deficit, despite improved production conditions.
While the silver price has surpassed its previous record high in 2011 and posted a revaluation against gold not seen since 2013, the market remains plagued by contradictory signals in the medium term. How can we explain the evolution of silver in 2025, and is this dynamic likely to continue?
Silver up 150% in 2025
Neglected for the past decade in favor of gold, silver now seems to be catching up. This growth is the result of a combination of cyclical and structural factors:
- First, the increase observed in 2025 confirms the upward trend that began in 2020. This upward trend is supported by a structural and persistent production deficit in the silver market.
- However, the extent of the rise in the price of silver in 2025 appears to be more attributable to the sharp increase in investments via ETPs, which have played a decisive role in the recent acceleration of the movement.

Source: Silver Prices - 100 Year Historical Chart
Silver thus surpassed its previous record high of around $50 per ounce set in 2011. Gold, meanwhile, had already surpassed its previous peak of 2011 by 2020. From this perspective, silver was lagging behind by about five years, a gap that now seems to have been partially closed. This catch-up phenomenon helps explain the scale and strength of the movement observed.
Strong growth in demand for financial investment, despite a decline in physical demand
For the fifth consecutive year, the silver market remains marked by a production deficit. This deficit is expected to reach nearly 95 million ounces in 2025, or approximately 3,000 tons of metal, corresponding to nearly 10% of global supply. However, this structural deficit is down from the levels seen in 2022 and 2023, although investment flows via ETPs are contributing to widening the actual deficit, which could reach nearly 300 million ounces.
At the same time, according to the Silver Institute, global demand for silver is expected to decline by 4% in 2025, to around 1.2 billion ounces. The decline would be particularly marked in the industrial demand, jewelry, and bullion and coin segments.
The Silver Institute states that “industrial demand is forecast to decline by 2% in 2025, to 665 million ounces,” a trend that reflects both global economic uncertainty related to tariff policies and geopolitical tensions, as well as intensified efforts to reduce silver intensity in a context of high prices. Similarly, “bars and coin demand is forecast to decline by 4% to a seven year low of 182 million ounces in 2025.”
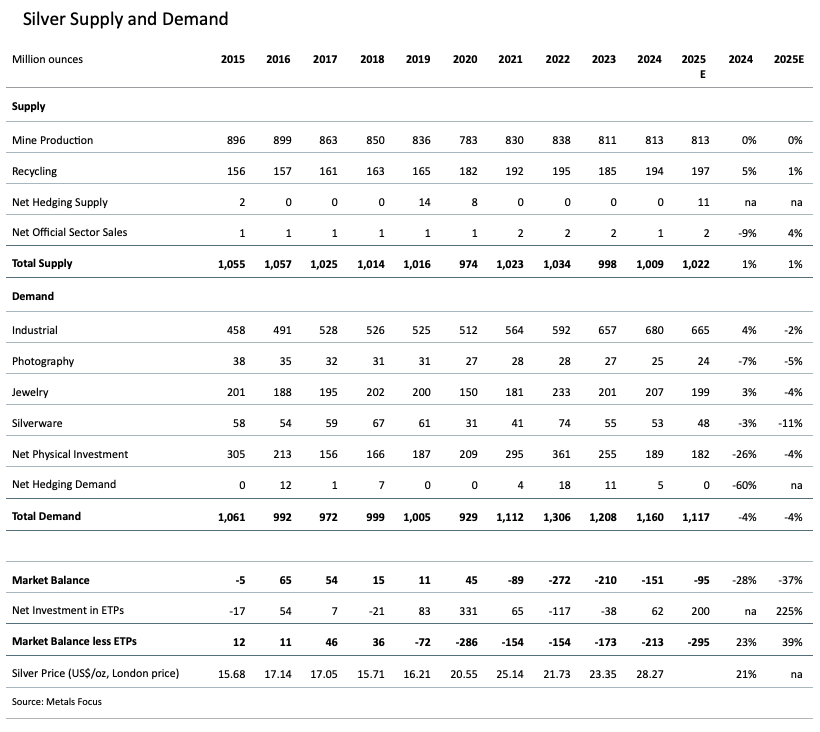
Source: The Silver Market is on Course for Fifth Successive Structural Market Deficit
The decline in physical demand is nevertheless offset by the increase in investment demand via ETPs, whose holdings rose by 18% year-on-year, driven by a net inflow of approximately 187 million ounces. With the majority of these holdings located in London, these buying flows contributed significantly to the liquidity tensions observed in the London market in the fall.
Production costs are decreasing
On the supply side, mining production remained broadly stable, albeit below its previous peak reached in 2022. However, the historically high margins achieved by mining companies could, in the long term, encourage a gradual recovery in mining activity.
The Silver Institute points out that the average cost of production "the average all-in sustaining cost (AISC) for H1.2025 fell 9% year on year to $13.0/oz, its lowest since H1.2022, as lower operating costs offset the rise in royalties and taxes. AISC margins rose, supported by a higher silver price, reaching $19.7/oz in the same period, the highest in over a decade." However, it should be noted that more than 70% of silver mining supply is secondary, with silver being extracted mainly as a by-product of other metals, such as gold, zinc, and copper.
Two main trends are emerging:
- A decline in demand for physical silver, largely offset by flows into ETPs.
- Stagnation in mining supply, despite a marked improvement in silver producers' margins.
In this context, silver production is likely to improve gradually over the long term. However, this process remains slow and uncertain, due to limited incentives to increase production for companies for which silver is often not the target metal. Furthermore, a possible decline in investment demand via ETPs could contribute to a phase of price consolidation. The evolution of demand for physical silver will therefore be a key indicator to watch in the first months of 2026.
Can silver's rise continue?
The gold/silver ratio fluctuated sharply in 2025. After exceeding the 100 threshold at the beginning of the year, it fell below 60 at the end of December. Silver's strong outperformance brought the ratio back to its 2013 levels, ending more than a decade of relative overvaluation of gold. It therefore appears that a major resistance zone around 100 has formed on the gold/silver ratio since the early 1990s, suggesting a possible trend reversal in favor of silver, whose ratio was below twenty in the early 1980s. However, major support levels remain to be crossed at this stage.

Source: Gold to Silver Ratio - 100 Year Historical Chart | MacroTrends
In early December 2025, Gregory Shearer, strategist at JP Morgan, estimated that “silver prices are forecast to rise toward $58/oz by the fourth quarter, averaging $56/oz for the full year, while platinum could continue to trade higher for longer next year before the gears of supply rebalancing gain momentum.” Banks therefore anticipate that silver could face a period of stagnation or even correction by the end of 2026.
Echoing the increase seen in 2010-2011
Recent months have revived investors' belief in a certain symmetry with the bull market of 2010-2011. Due to the close correlation between gold and silver prices, it is indeed possible to identify a 15-year cycle in the evolution of silver prices. However, the scale of the movement observed makes both the duration and intensity of the current cycle uncertain.
Furthermore, the existence of intermediate cycles of four to eight years shows an average 12-month performance of between 25% and 30%. However, the current movement appears to be significantly earlier than historical observations suggest, although a comparison with the dynamics observed fifteen years ago reveals a telling parallel. At this stage of the cycle, the trajectory of the price of silver therefore remains particularly volatile and uncertain.

Data source: yfinance
In particular, we can see that the symmetry with the 2010-2011 movement is becoming more pronounced. The immediate effect of this configuration is to reinforce the influence of long cycles on the price of silver, as illustrated by the yellow area at the top of the spectrum in the chart below. Such phases of long-term cycle dominance, which can last for one to two years, are also conducive to the emergence of peaks in the silver market, similar to those observed in 2011 and 2021. From this perspective, a phase of consolidation in the price of silver could be a more favorable signal in the long term, allowing for the establishment of a more solid and better-structured growth dynamic.

Data source: yfinance
This context of technical overheating, marked by a surge in performance in the final weeks of 2025, has been accompanied by a sharp resurgence in volatility in the price of silver. Annualized volatility was around 50% at the end of December 2025, compared with around 25% in mid-summer. Nevertheless, it remains below the peaks observed during the episodes of 2011 and 2021, when it exceeded 80%. This signal indicates that, despite the spectacular rise in silver and increased price instability, the extreme levels reached during previous records have not, at this stage, been exceeded.
Silver: An Indispensable Metal for the Future
A new report published by the Silver Institute, entitled “Silver, The Next Generation Metal” and produced in collaboration with Oxford Economics, indicates that global demand for silver is expected to grow significantly in several key technology sectors over the next decade.
This increase in demand is mainly driven by three major areas:
- Photovoltaic technology: already consuming around 29% of industrial silver in 2024, it is expected to remain one of the main outlets for the metal, due to the continued expansion of solar capacity worldwide as part of the energy transition. However, improvements in technology may reduce the concentration of silver in panels. The report states that “the average annual growth (CAGR) in global solar capacity is expected to be 17% between now and 2030.2 This rapid growth means that by 2030, the IEA expects solar PV will become the foremost renewable electricity source.”
- Electrification of the vehicle fleet: the shift from internal combustion vehicles to electric vehicles is expected to lead to a sharp increase in silver consumption. According to projections, the share of electric vehicles in automotive silver demand is expected to exceed that of combustion vehicles by 2027 and reach around 59% of the global automotive market by 2031. An electric vehicle contains an average of 25 to 50 grams of silver, compared to 18 to 34 grams for a hybrid vehicle. The report estimates that silver demand from the automotive sector could grow at an annual rate of around 3.4% through 2031.
- Data centers and artificial intelligence: The rapid growth in computing power requirements for digital services and AI applications is driving a parallel increase in demand for servers and data center infrastructure. This equipment incorporates numerous electronic components that use silver for its conductivity properties.

Source: Next Generation Metal
Conclusion
The price of silver significantly outperformed in 2025. This performance is part of a revaluation trend that began in 2020, against a backdrop of structural market deficits. However, this factor alone does not sufficiently explain the scale of the recent movement.
The increase in financial investment demand has contributed significantly to the rise in the price of silver, particularly in the last few weeks of 2025. In the space of a few months, the gold/silver ratio has returned to levels last seen in 2013.
In this context, the trend could continue if physical demand rebounds and investor appetite remains strong. Conversely, a decline in flows to silver-backed ETPs could slow the momentum seen this year.
Finally, although silver remains a strategic metal and is becoming increasingly scarce, production conditions are expected to improve in the medium term. This development, combined with a slight decline in physical demand in 2025, could be a decisive factor in the market equation in 2026. The significant volatility of the price of silver at the end of 2025 makes the potential trajectory of the gray metal more uncertain.
More By This Author:
Gold & Silver Year-End Review: The Party Has Just BegunGeopolitical Risk Dismissed By The Markets, Priced In By Precious Metals
Silver: A Broken Market Before A “Reset”?

Comments
Log in or sign up to join the conversation.