
Oil Touches $60/bbl
Energy
ICE Brent briefly touched US$60/bbl yesterday, however, failed to break through and move higher. Brent has rallied more than 11% from the lows seen in early February, as market fears over the coronavirus ease, helped also by government stimulus. We still believe that the market is likely to trade lower from current levels, given the scale of the surplus over the first half of this year, and the need for the market to send a signal to OPEC+ that they must take further action at their meeting in early March.
Meanwhile yesterday the EIA released its weekly report, which showed that US crude oil inventories increased by just 415Mbbls, much lower than the 3.2MMbbls that was expected by the market, according to a Bloomberg survey. The smaller than expected increase was driven predominantly by a jump in exports, which increased by 594Mbbls/d over the week to average 3.56MMbbls/d. Meanwhile, refinery run rates also increased by 1.4 percentage points over the week, despite the Baton Rouge refinery fire - although this is likely to be reflected in next week’s report. Looking at products, distillate fuel oil cracks saw a smaller than expected drawdown of 635Mbbls, on the back of poorer demand and increased run rates. This smaller draw has put some immediate pressure on heating oil cracks.
Sticking with refined products, and the latest data from Global Insights shows that inventories in the ARA region fell by 157kt over the last week to total 5.2mt. The biggest decline was seen in middle distillates, with gasoil stocks falling by 112kt WoW, leaving them at 2.25mt - levels last seen in January last year. Falling middle distillate stocks in Europe appears to have arisen due to reduced flows from the Middle East, where there is planned refinery maintenance ongoing. Meanwhile, in Singapore, oil product inventories increased by 2.55MMbbls over the week to total 49.4MMbbls - levels last seen in March last year.
Finally, the EIA also released its weekly gas inventory report yesterday, which showed that natural gas inventories in the US fell by 151bcf over the week, which was more than the 5 year average of a 136bcf decline, and higher than the 145bcf expected by the market. However, total US gas inventories are 35% higher YoY, and more than 9% higher than the 5 year average. These large stock levels continue to weigh on Henry Hub prices, whilst a weak global LNG market offers little support for the US domestic market.
Metals
Base metals were largely weaker yesterday, with the USD index surging to a two-year high of 99.8. Developments in China continue to be mixed - on a positive note, cases of new infections of Covid-19 dropped sharply after the methodology of diagnosis was changed again, whilst the PBoC provided further support to the economy. However, industrial capacity cuts, trade/travel restrictions and a slowdown in consumer sales will continue to put a strain on metals demand.
Meanwhile, data from the International Aluminium Institute shows that global aluminum output increased 0.2% MoM (+0.6% YoY) to 175.8kt/day (total 5,451kt) in January. China’s aluminum output was up 1.2% MoM to average 99.4kt/day, while for the rest of the world, aluminum production was down 1.2% MoM to average 76.4kt/day. Higher smelting profits, on the back of weak alumina prices encouraged Chinese smelters to ramp up output in January. However, February could see a sharp drop in output as a result of supply chain disruptions.
The iron ore market defied the weakness seen in the base metals complex yesterday, with the most active contract on the SGX rallying by 2.4%, and settling at US$89.2/t. Export disruptions from Australia, following a cyclone, along with Rio Tinto revising lower its shipment guidance for this year have proved supportive for the market. Meanwhile, there have been reports of increased steel product exports from China to the region, with poorer domestic demand due to Covid-19.
Agriculture
Finally, in the USDA’s initial outlook for US crops in 2020, the agency expects increases of 4.8% and 11.7% YoY in US corn and soybean acreage. The USDA forecasts that corn and soybean acreage for the 2020/21 season of 94m acres and 85m acres respectively. Last year's plantings were disrupted by very wet conditions during the planting season, an incident one would not expect to repeat itself. The USDA’s outlook also gave estimates on export numbers, which shows an estimated YoY increase of around US4b in US agricultural exports for the year ending 30 September. This is a far cry from the $12.5b additional agricultural exports (from a higher 2017 base) that China agreed to buy under the phase one trade deal. This suggests that the targets of the phase one deal will be extremely difficult to hit. Although potentially ethanol could make up some of this difference, with it included under agriculture in the trade deal, but not in the USDA numbers.
Daily price update
(Click on image to enlarge)
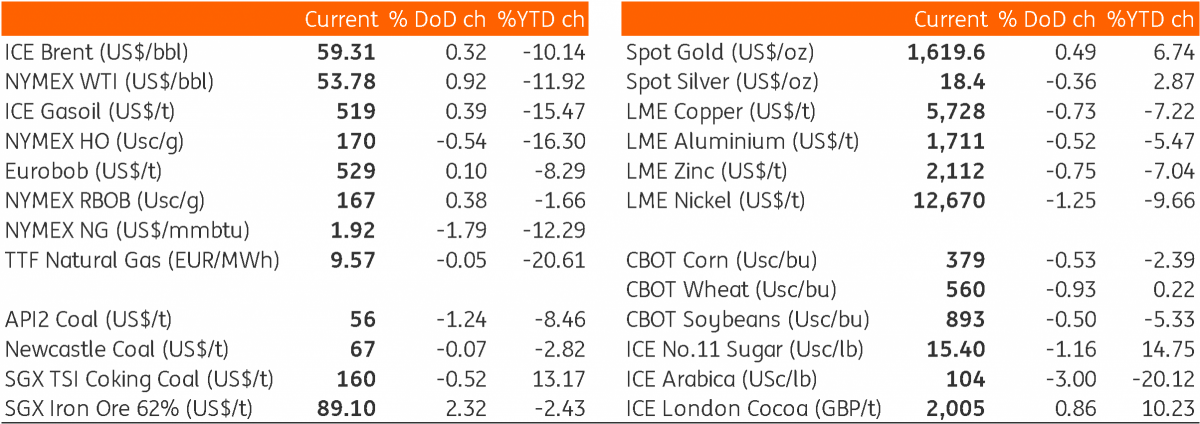
Bloomberg, ING Research
The information does not constitute investment recommendation, and nor is it investment, legal or tax advice or an offer or solicitation to purchase or sell any financial instrument. more


Stocks are waking up while oil goes back to sleep. Interesting.