
Oil Stays Flat Ahead Of API Release Later This Tuesday
Oil continues is winning streak for a fifth consecutive trading session after prices jumped substantially on Monday despite the bearish demand outlook from OPEC. The International Energy Agency (IEA) is following that narrative, pointing to the risk of a substantial surplus while OPEC is set to let loose of its production cuts. Still, geopolitical tensions over an immediate attack from Iran to Israel keep prices supported, and traders seem to be betting on OPEC deepening their production cuts to further support the black gold.
The US Dollar Index (DXY), which tracks the performance of the US Dollar against six major currencies, is getting torn between two major forces this Tuesday on the quote board. On the one hand, the much battered carry trades from last week are making a comeback against the US Dollar. On the other side, the Greenback itself is outpacing the Japanese Yen (JPY). This results in a near standstill in the DXY US Dollar Index chart ahead of Tuesday’s US Producer Price Index (PPI) numbers and Wednesday’s Consumer Price Index (CPI) release.
At the time of writing, Crude Oil (WTI) trades at $78.27 and Brent Crude at $81.42.
Oil news and market movers: Bearish outlook means reaction soon
- The monthly IEA report shows that OPEC output rose by 250,000 barrels per day against previous month. Saudi Arabia and Iraq were the main drivers for the additional output.
- Even if OPEC cancels its plans to hike production back to normal, inventories will accumulate next year by 920,000 barrels a day amid booming supplies from the US, Guyana and Brazil, according to the IEA.
- Reuters reports ahead of the numbers from the American Petroleum Institute (API) that the US reserves should be depleted with summer demand having peaked by now.
- The weekly Crude Oil Stock print will be released by the American Petroleum Institute at 20:30 GMT. The previous number showed a marginal build of only 180,000 barrels.
Oil Technical Analysis: Last few dollars
Oil price is shooting for the stars since Monday. The fact that both OPEC and the IEA are seeing substantial supply surplus at hand has traders doubling down on changes from OPEC, away from its commitment to reduce production limitations. Instead, more output might be needed, with risk of a split division within OPEC again.
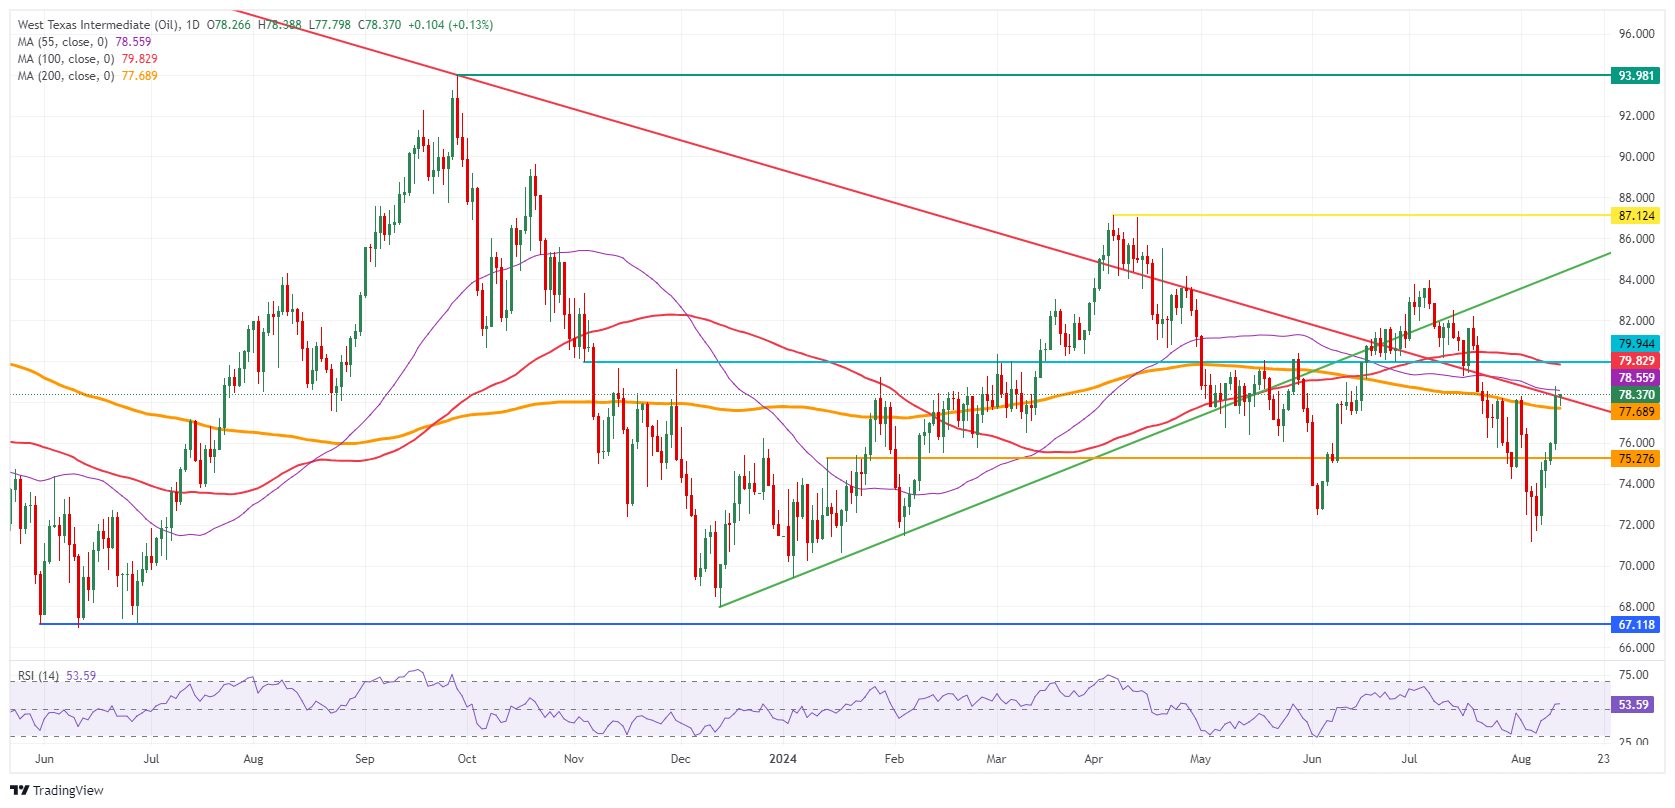
On the upside, two other major moving averages are very close, with the 55-day Simple Moving Average (SMA) at $78.56 and the 100-day SMA at $79.83. If that 100-day SMA gets cleared, the $80 area opens up with an ultimate profit target level at around $87.12.
On the downside, the 200-day SMA came in for support on some profit taking in Asia at $77.69. Should price action slide back below it, a quick dip to $75.27 could be in the cards in a washout of this rally. A full unwind back to the start of the rally near $72.00 is possible in case of some bearish headlines or catalyst.
(Click on image to enlarge)
More By This Author:
US Dollar Rolls Through Markets, Fueled By Gains Against YenEUR/USD Flirts With Break Below 1.09 While Greenback Sets The Record Straight
US Dollar Eases Ahead Of CPI While Pressure On Biden Builds
Disclaimer: Information on this article contains forward-looking statements that involve risks and uncertainties. Markets and instruments profiled on this page are for informational purposes ...
more

