Oil Sanctions And Recession
After a wild ride up to $130 a barrel, the price of oil has come back down to its level from before Russia invaded Ukraine. Russian oil may be finding buyers despite the sanctions, and U.S. production continues to recover. But the situation remains very uncertain, and a big disruption in the quantity of Russian oil that reaches world refineries is a very significant possibility. In my previous post, I examined the causes of the run-up in the price of oil that had already occurred before the invasion and discussed the implications for U.S. inflation. Today I comment on the possible implications of further supply disruptions for U.S. real GDP.
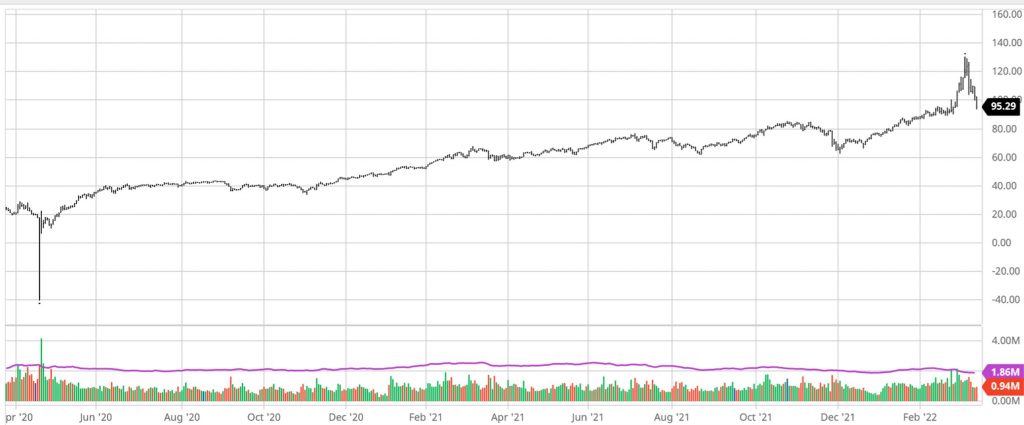
Price of April 2022 crude oil futures contract, from Barchart.com.
Russia accounts for 13% of the world’s field production of crude oil and 17% of the world’s natural gas. While gas is a relatively local commodity, oil is readily transported. Although different grades of crude sell at different prices, to a first approximation it is a world market for oil with a single world price. Disruptions in production anywhere in the world change the price for everybody in the world. What would be the consequences if the U.S. and the rest of the world suddenly had to reduce our consumption of oil by 13%?
The total retail value including taxes of refined petroleum products sold in the U.S. amounts to about 4% of U.S. GDP. Thirteen percent of 4% is (0.13)x(0.04) = 0.005, or half of 1%. Thus the dollar value of a 13% reduction in the use of petroleum products only amounts to half of one percent of GDP. For comparison, in a typical U.S. recession, real GDP falls 5% below trend — ten times as much. Moreover, the value share of energy in the U.S. economy has been falling over time, leading some to conclude that we are less vulnerable to a supply disruption today than we were 40 years ago.
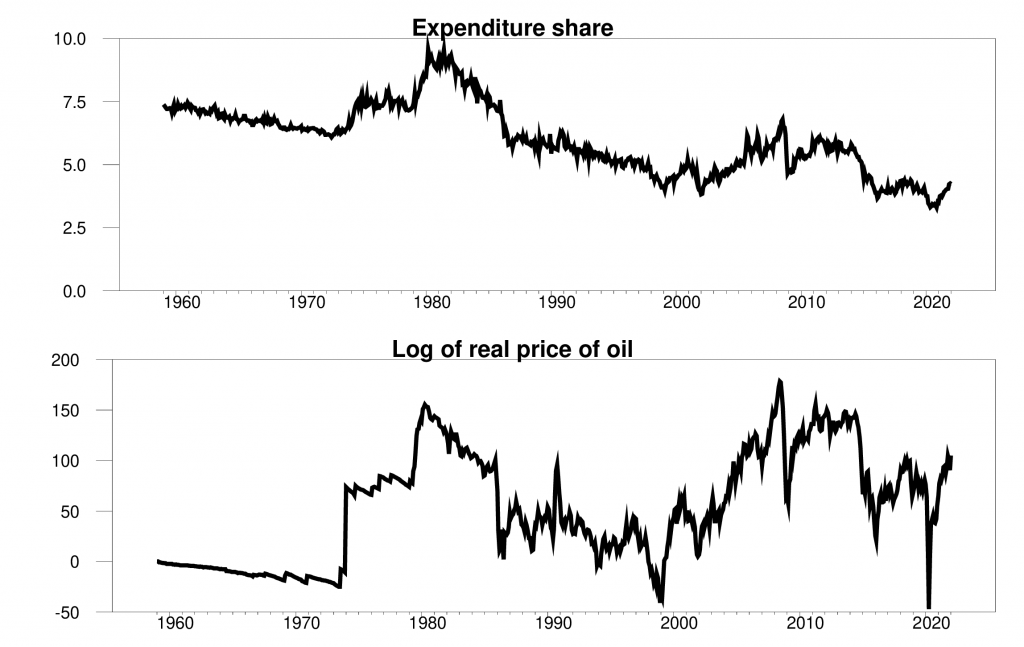
Top panel: dollar value of consumer purchases of energy goods and services as a percentage of total consumer spending, monthly, Jan 1959 to Jan 2022. Bottom panel: 100 times the natural logarithm of ratio of spot price of West Texas Intermediate to the overall consumer price index.
But the expenditure share did not follow a steady trend down. When the relative price of oil goes up rapidly — as it did, for example, in the 1970s — the expenditure share goes up. This is a result of the low price elasticity of the demand for oil. If despite a doubling in the price of gasoline you buy the same number of gallons of gasoline this month as last, the share of your spending devoted to gasoline doubles. If there is a significant reduction in Russian oil production, we will see a big increase in price, and that expenditure share will go up. In calculating the economic value of the lost oil, which share should we use — the share before the supply disruption, or the share after?
A recent paper by Baqaee and Farhi (2019) develops an approach that deals with this issue and a new paper by Bachmann, Baqaee, and many others applies those insights to the current situation in Europe. They analyze the consequences of a complete cessation of German imports of oil and natural gas from Russia. They conclude that the economic cost would amount to 0.5 to 3.0% of GDP, with the range depending on the extent to which Germany can make substitutions. Even the upper end of this range is manageable, and less than the output lost in a typical recession.
Another way that we might try to answer this question is to look for historical precedents. In October 1973, the Arab members of OPEC announced an embargo on oil sales to the U.S. and other countries that were seen as supporting Israel. The black line in the graph below plots the decrease in oil production from the Arab members of OPEC as a percent of total world production. The maximum shortfall reached 7% of world production. There was some increase in production from other countries at that time, but not much. The total decline in global production from all countries is shown in blue.
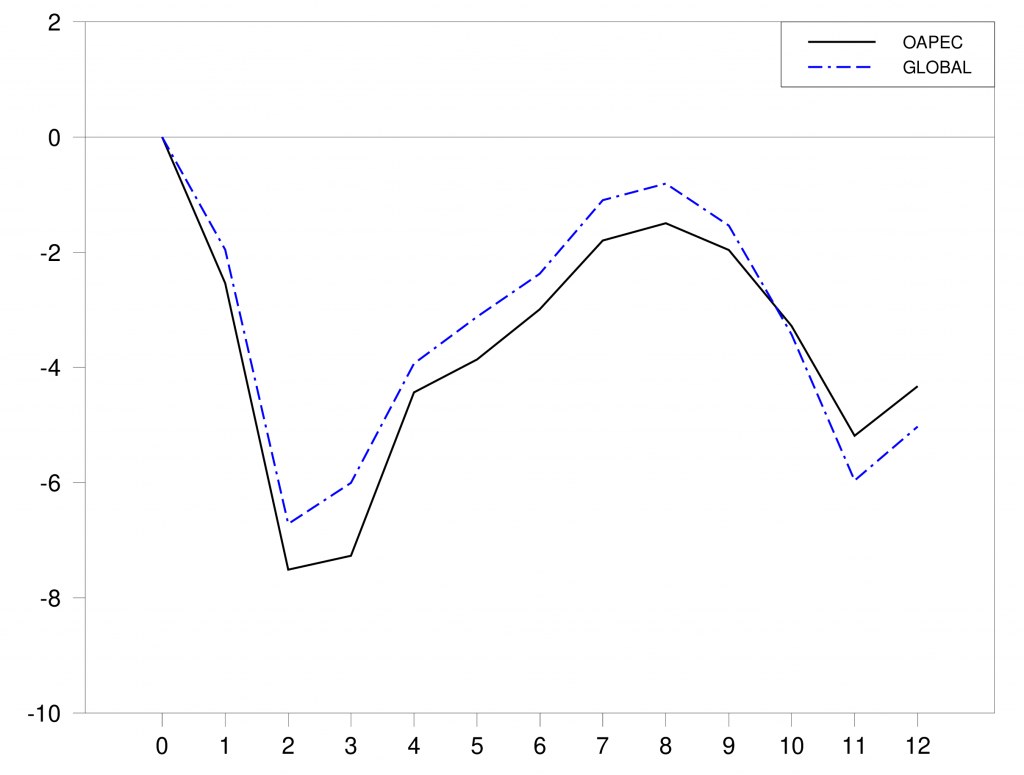
Oil production after the 1973 Arab-Israeli War. Dashed blue line: change in monthly global crude oil production from September 1973 as a percentage of September 1973 levels. Solid black line: change in monthly oil production of Arab members of OPEC from September 1973 as a percentage of global levels in September 1973. Horizontal axis: number of months from September 1973. Source: Hamilton (2013).
Another example comes from the Iranian revolution in 1978. This also knocked out about 7% of world oil production. But in this case, increased production from other countries limited the global shortfall to about 4%.
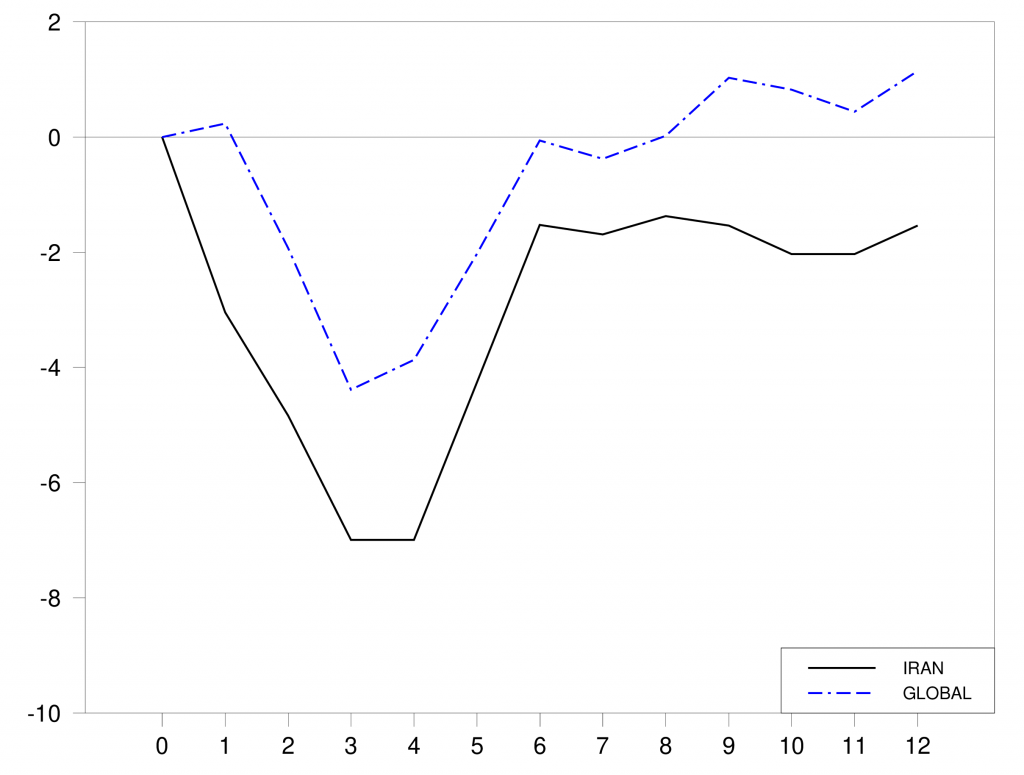
Oil production after the 1978 Iranian revolution. Dashed blue line: change in monthly global crude oil production from October 1978 as a percentage of October 1978 levels. Solid black line: change in monthly Iranian oil production from October 1978 as a percentage of global levels in October 1978. Horizontal axis: number of months from October 1978. Source: Hamilton (2013).
The table below summarizes these episodes along with two other historical examples of significant oil supply disruptions. In each of these episodes, we saw a decrease in the world supply of around 5%. If there were a 50% reduction in the amount of Russian oil that reaches the market, it would represent a shock as big as any of these four examples. A complete cessation of Russian production accompanied by shutting down natural gas as well would be the biggest energy supply disruption in history.
(Click on image to enlarge)

Each of the above oil supply disruptions was followed by a recession in the United States. If the quick calculation above of the economic value of lost oil is correct, we would conclude that the fact that these episodes were followed by recessions must just be a coincidence and that the major cause of the economic downturns is to be found elsewhere.
A defining feature of economic recessions is underutilized factors of production. In a recession, we see the unemployment rate spike up as people who had been working lose their jobs and can’t find new ones. Factories that had been busy operate at less than full capacity. If underutilized resources are one consequence of an oil supply disruption, then the economic cost would be far greater than the above simple calculations that assumed that the only thing we lost could be measured by the market value of the oil itself.
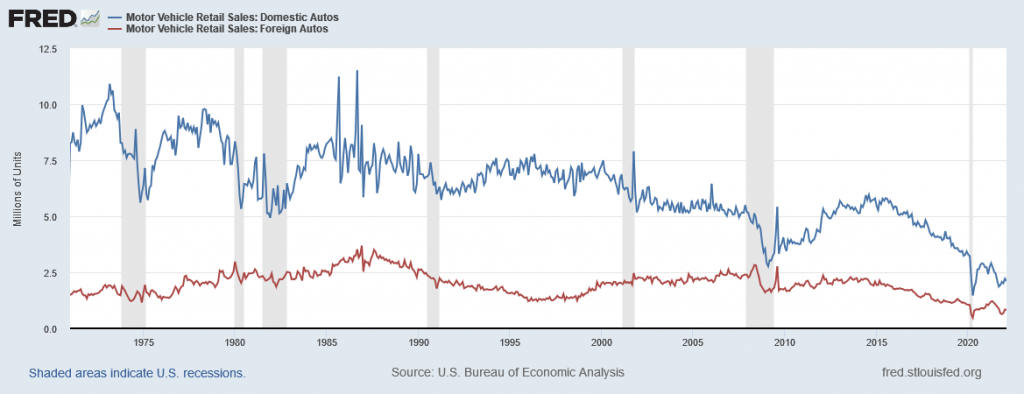
Automobile production is surely one part of the story. There was a big drop in auto sales and production in the above four episodes, and also in other episodes in which the price of oil increased very sharply over a short period of time. Auto workers were laid off, and the factories turned out far fewer vehicles than previously. Perhaps the hit to autos came from factors other than gas prices. But we usually see auto sales begin to fall when oil prices start to spike, and often this is many months before the recession begins. For example, gasoline prices were rising dramatically in 1973 and car sales were falling well before the embargo and well before the official start of the recession. Price increases and falling auto sales associated with the Iranian revolution also both started well before the recession. Moreover, we often see sales of more fuel-efficient vehicles go up at the same time as sales of gas-guzzlers is declining. It seems hard to argue that gasoline prices played no role in these developments.
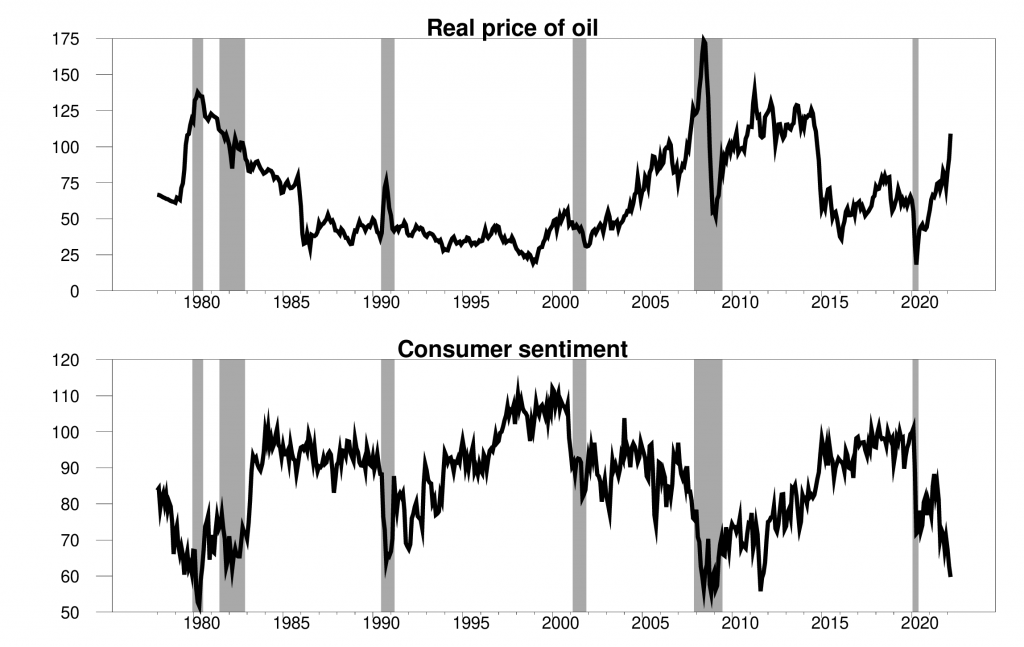
And although gasoline expenditures are a relatively modest part of average consumption expenditures, the situation can be very different depending on which individual you’re looking at. Kuhn, Kehrig, and Ziebarth (2021) found that 10% of U.S. consumers spend no money at all on gasoline, while a different 10% devote more than 10% of their budget to gasoline. The median U.S. household spends 4%. Many of those households try to keep buying the same number of gallons of gasoline when the price doubles, meaning they have to cut back on spending somewhere else. We see a strong correlation in the data between gasoline prices and consumer sentiment. It seems likely that big changes in gasoline prices cause significant cutbacks in other categories of spending. Lower demand for these products again leads to unemployed workers and underutilized capital in those industries.
The conventional view of the way in which abrupt changes in spending patterns can lead to a drop in real GDP emphasizes the failure of nominal prices to adjust sufficiently quickly in response to a decrease in demand. If this is the mechanism, we could counter some of the effects of an oil shock with monetary and fiscal stimulus to try to keep aggregate demand high.
My view is that the reason changes in demand lead to underutilized resources is because of technological barriers to changing production methods quickly. The factories cannot instantly shift from making the large cars that people no longer want to making the small cars that they now desire. Fiscal or monetary stimulus cannot fix this problem. I develop this idea in more detail in a recent paper.
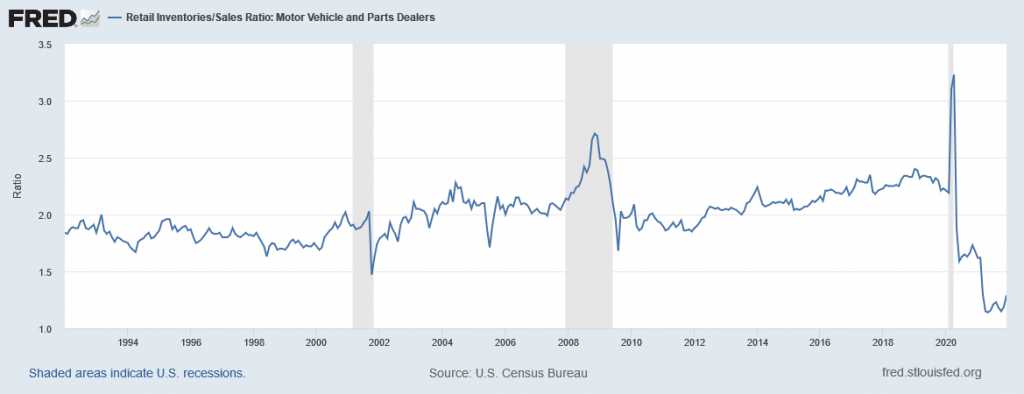
Where do things stand right now? The above graph shows that consumer sentiment is sinking in the current episode, just as it did in previous oil price spikes. However, the situation with the auto industry today is quite different from earlier episodes. Auto production has been depressed not because of inadequate demand, but instead because of problems with supply, for example, problems obtaining computer chips. This by the way is another example of the broader argument I’m making. You can’t judge the size of the disruption caused by the chip shortage by just looking at the dollar value of the chips. If you can’t build a modern car without them, then the resources lost go far beyond the dollar value of the chips themselves. But the fact that supply rather than demand has been a key limiting factor means that a drop in demand for cars will not have the same aggregate implications as it would have in a normal market environment. I had been anticipating a big boost to GDP as auto dealers restock depleted inventories. That won’t happen to the same degree now, which lowers my growth forecast for 2022. But it’s not going to bring auto sales below the levels of 2021.
Based on what has happened so far, I don’t think the U.S. is currently headed for a recession. But I have a significantly more pessimistic view than some other economists of the likely effects if we do see a big drop in shipments of Russian oil and natural gas. Given the localized market for natural gas, I think Europe faces some real challenges if the supply suddenly stops.
Let me close with one final comment. I have been discussing here only the economic consequences of the tragic events currently unfolding in Europe. But the situation in Ukraine is much more frightening and horrific than any of the concerns I have been talking about. My personal view is that we should push hard for stronger sanctions to take away the revenue that Putin is using to finance the ongoing misery and bloodshed.
We should have no illusions about what the costs of doing that could be for everybody. But the costs to all of us if Russia succeeds are far greater.
Disclosure: None.


