
Oil Price Rebound Takes Shape As Crude Defends October Low

The price of oil carves a series of higher highs and lows even as the US announces that “the Department of Energy will make available a release of 50 million barrels of oil from the Strategic Petroleum Reserve to lower prices for Americans,” and crude may continue to retrace the decline from the monthly high ($84.97) as it shows a limited reaction to an unexpected rise in US inventories.
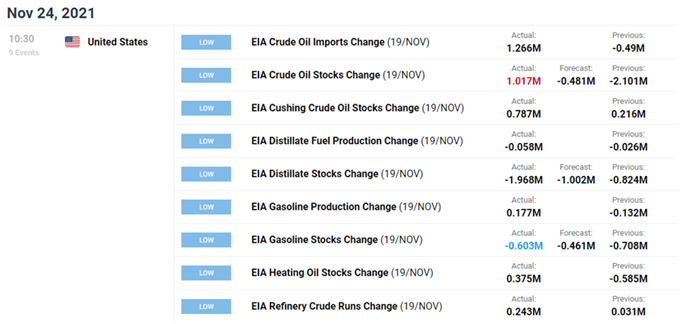
US stockpiles increased 1.017M in the week ending November 19 versus forecasts for a 0.481M decline, and it seems as though the recent developments will do little to derail the bullish price action as the Organization of Petroleum Exporting Countries (OPEC) remain reluctant to push production towards pre-pandemic levels.
In turn, the price of oil may exhibit a bullish trend throughout the remainder of the year with OPEC and its allies on track to “adjust upward the monthly overall production by 0.4 mb/d for the month of December,” and it remains to be seen if the group will adjust the production schedule at the next Ministerial Meeting on December 2 as the Monthly Oil Market Report (MOMR) highlights that “world total demand in 2022 is now estimated to reach 100.6 mb/d, around 0.5 mb/d above 2019 levels.”
With that said, current market conditions may keep crude afloat as OPEC and its allies keep a cap on production, and the price of oil may continue to retrace the decline from the monthly high ($84.97) as it carves a series of higher highs and lows after defending the October low ($74.23).
OIL PRICE DAILY CHART
(Click on image to enlarge)
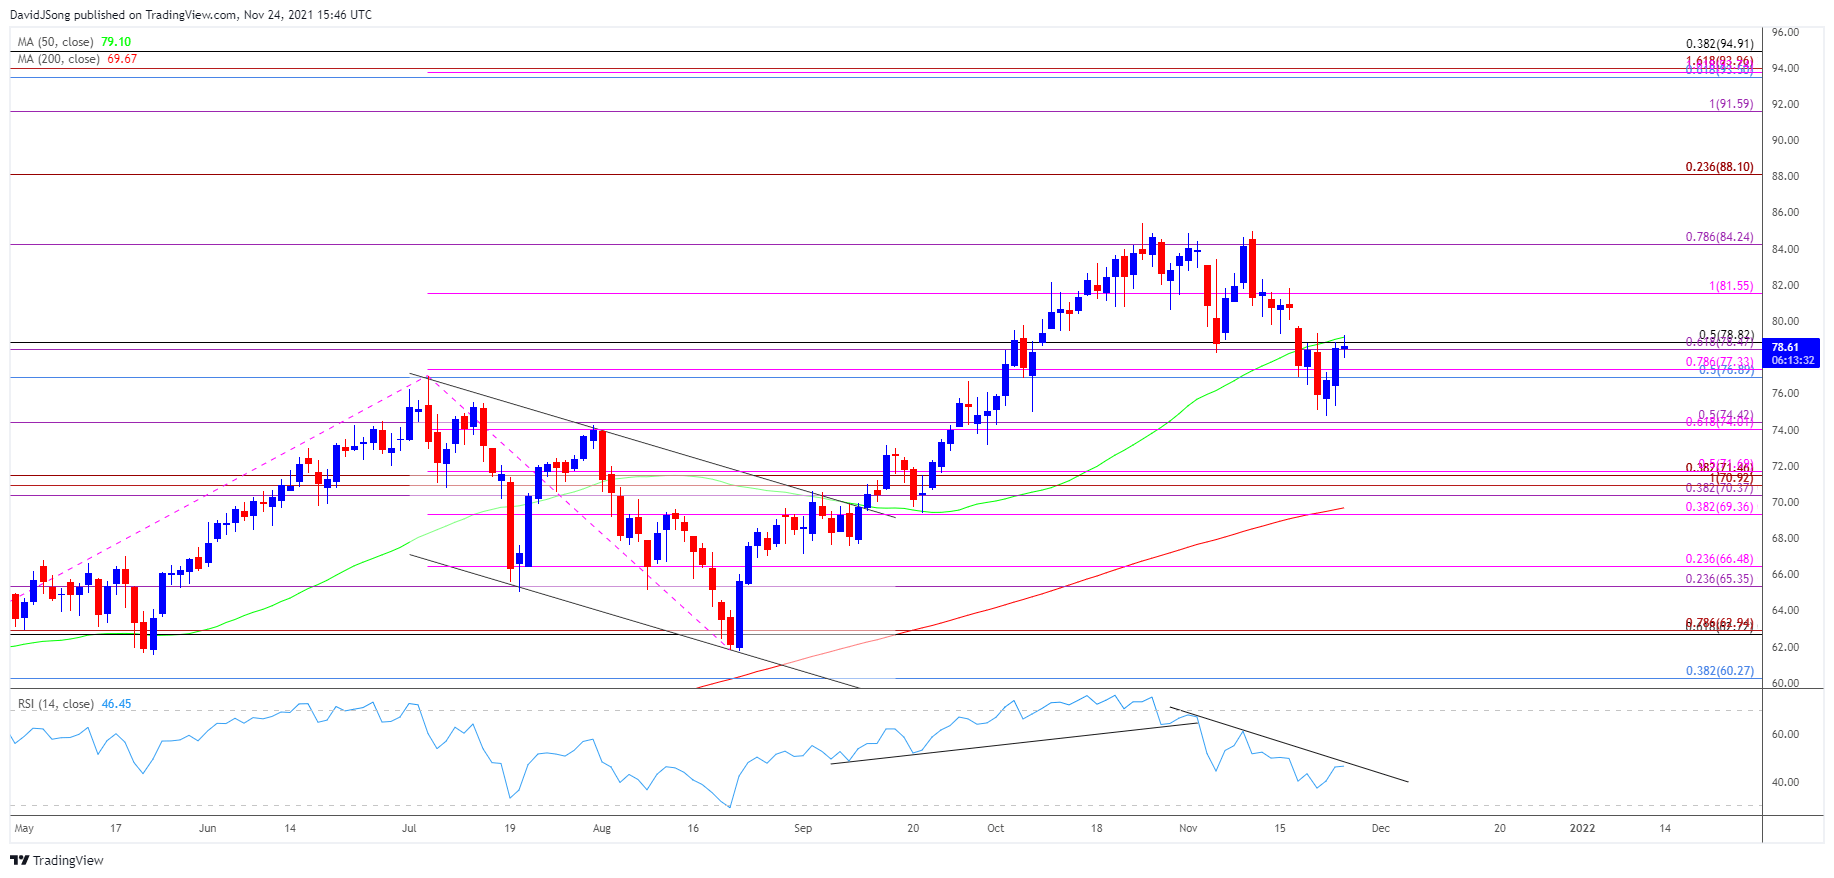
Source: Trading View
- Keep in mind, the price of oil cleared the July high ($76.98) after defending the May low ($61.56), with the 50-Day SMA ($79.10) establishing a positive slope during the same period as crude broke out of the descending channel from earlier this year.
- As a result, the rally from the August low ($61.74) pushed the Relative Strength Index (RSI) above 70 for the first time since July, but crude reversed ahead of the October 2014 high ($92.96) as the oscillator fell back from overbought territory to indicate a textbook sell signal.
- More recently, the failed attempts to test last month’s high ($85.41) has generate price gaps in crude as it trades below the 50-Day SMA ($79.10) for the first time since September, but the price of oil appears to have reversed ahead of the October low ($74.23) as it carves a series of higher highs and lows.
- Lack of momentum to test the $74.00 (61.8% expansion) to $74.40 (50% expansion) region has pushed the price of oil back above the Fibonacci overlap around $76.90 (50% retracement) to $77.30 (78.6% expansion), but need a close above the $78.50 (61.8% expansion) to $78.80 (50% retracement) zone to bring the $81.60 (100% expansion) area on the radar.
- Next area of interest comes in around $84.20 (78.6% expansion), with a break above the October high ($85.41) opening up the $88.10 (23.6% expansion) region.
Disclosure: See the full disclosure for DailyFX here.


