
Oil Price Outlook: Crude Rally Halted At Resistance– WTI Weekly Chart
Oil prices rallied more than 19% off the June lows before failing at a key resistance last week and leaves the recent advance in a precarious position heading into the start of the week. These are the updated targets and invalidation levels that matter on the crude oil weekly price chart (WTI).
OIL PRICE CHART - WTI WEEKLY
(Click on image to enlarge)
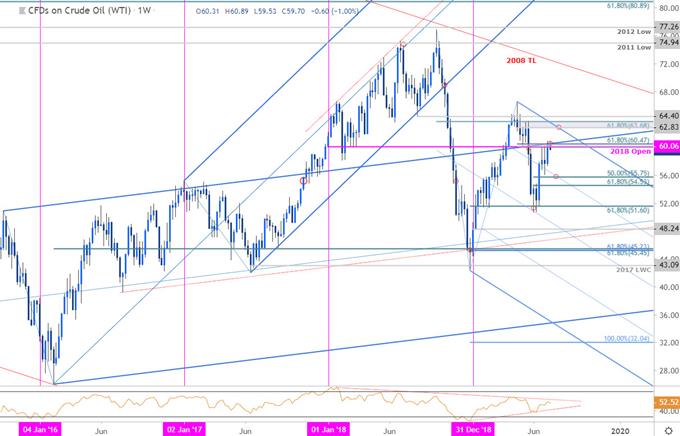
Notes: In my last Oil Price Outlook we noted that the crude rally was, “approaching a critical resistance pivot we’ve been tracking for months now at 60.06/45 and we’re looking for a reaction here.” Oil prices failed to mark a daily close above this threshold and the attempted breach above the monthly opening-range leaves the immediate rally vulnerable while below this key zone.
Monthly open support rests at 58.15 backed by confluence support at the 50% retracement of the June advance at 55.75. Ultimately a break/close below 54.53 would be needed to mark resumption of the broader downtrend. A topside breach above 60.47 would keep the focus on the upper parallel / yearly high-week close at 62.83 – look for a bigger reaction there IF reached. Ultimately a weekly close above 63.68would be needed to suggest a more significant advance is underway.
For a complete breakdown of Michael’s trading strategy, review his Foundations of Technical Analysis series on Building a Trading Strategy
Bottom line: The immediate oil price advance is vulnerable while below confluence resistance at 60.06/47. From a trading standpoint, a good place to reduce long-exposure / raise protective stops. Be on the lookout for possible topside exhaustion to give way to a larger pullback in crude. I’ll publish an updated Oil Price Outlook once we get further clarity on near-term price action. Review my Top 2019 Trading Opportunities for a look at the longer-term look at the Oil Outlook.
OIL TRADER SENTIMENT (WTI)
(Click on image to enlarge)
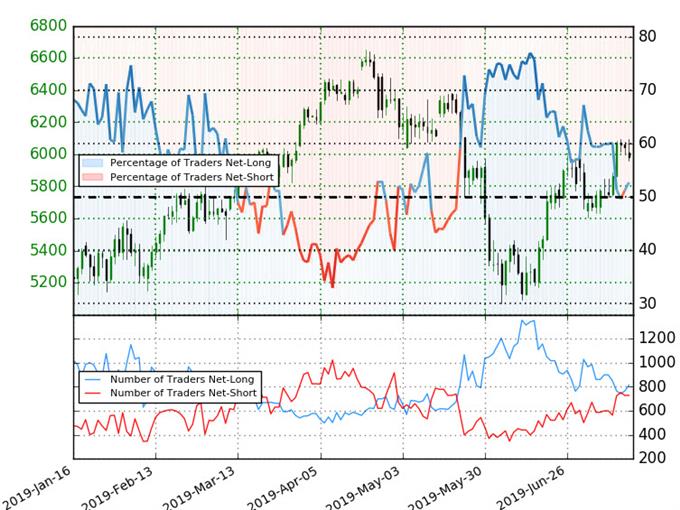
- A summary of IG Client Sentiment shows traders are net-long Crude Oil - the ratio stands at +1.12 (52.8% of traders are long) – bearish reading
- Long positions are 5.0% higher than yesterday and 9.1% lower from last week
- Short positions are 7.5% lower than yesterday and 10.0% higher from last week
- We typically take a contrarian view to crowd sentiment, and the fact traders are net-long suggests Oil prices may continue to fall. Traders are further net-long than yesterday & last week, and the combination of current positioning and recent changes gives us a stronger Crude Oil-bearish contrarian trading bias from a sentiment standpoint.


