

The price of oil trades to a fresh weekly high ($89.72) despite an a larger-than-expected rise in US inventories, and recent price action raises the scope for higher crude prices as it extends the series of higher highs and lows from earlier this week.
(Click on image to enlarge)
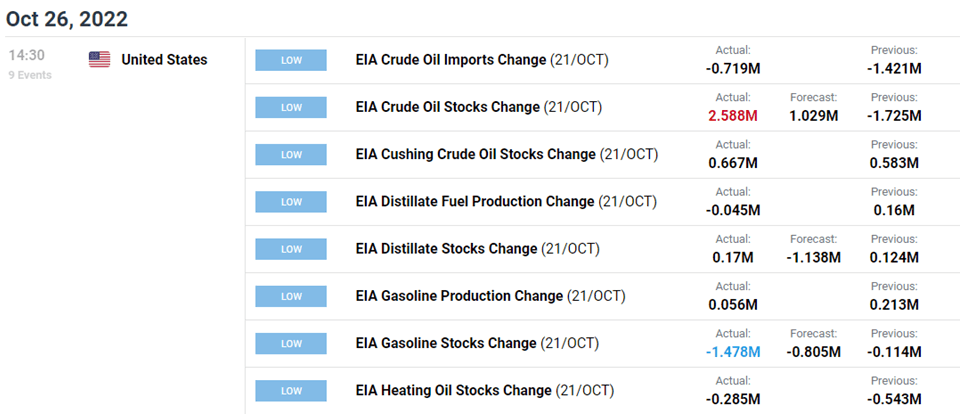
Crude seems to be unfazed by the 2.588M rise in US inventories as it rallies for three consecutive days, and the advance from the September low ($76.25) may turn out to be a key reversal should the price of oil no longer respond to the negative slope in the moving average.
As a result, crude may continue to retrace the decline from earlier this month as the Organization of Petroleum Exporting Countries (OPEC) plans to “adjust downward the overall production by 2 mb/d” starting in November, and it remains to be seen if the group will continue to adjust its output schedule at the next Ministerial Meeting on December 4 as the Monthly Oil Market Report (MOMR) warns of slowing demand.
(Click on image to enlarge)

Until then, expectations for less supply may keep the price of oil afloat as US production remains below pre-pandemic levels, with the figures from the Energy Information Administration (EIA) showing weekly field output printing at 12,000K for the second week.
With that said, recent price action raises the scope for a further advance in crude as it extends the series of higher highs and lows from earlier this week, and the price of oil may continue to retrace the decline from the monthly high ($93.48) as it breaks out of a bull-flag formation.
Crude Oil Price Daily Chart
(Click on image to enlarge)
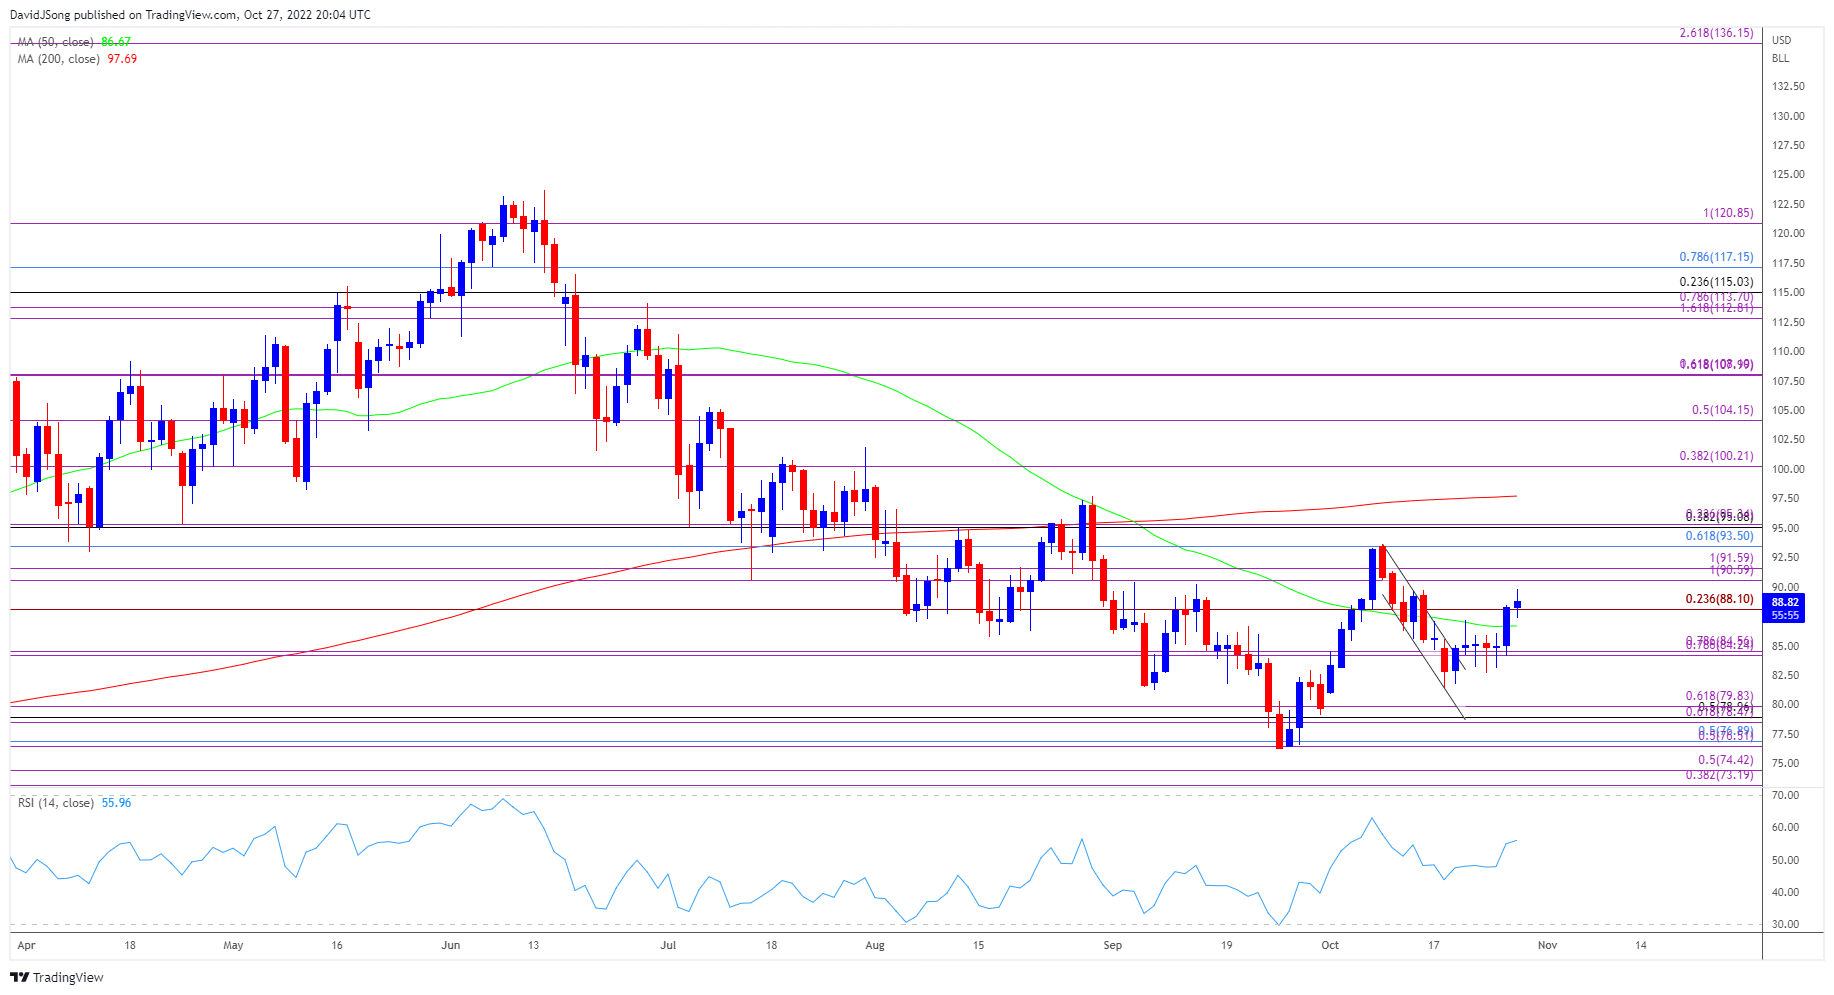
Source: Trading View
- The price of oil appears to have reversed course after defending the monthly low ($80.87) as it breaks out of a bull-flag formation, with crude trading back above the 50-Day SMA ($86.68) as it carves a series of higher highs and lows.
- Crude may no longer respond to the negative slope in the moving average as it continues to retrace the decline from the monthly high ($93.48), but need a break/close above the 90.60 (100% expansion) to $91.60 (100% expansion) region to bring the Fibonacci overlap around $93.50 (61.8% retracement) to $95.30 (23.6% expansion) on the radar.
- Next area of interest comes in around the 200-Days SMA ($97.70), with a move above the moving average opening up the $100.20 (38.2% expansion) area.
More By This Author:
Gold Price On Track To Test 50-Day SMA Ahead Of US PCE ReportEUR/USD On Track To Clear Monthly Opening Range Ahead Of ECB Meeting
Gold Price Reverses Ahead of Yearly Low to Eye 50-Day SMA

Comments
Log in or sign up to join the conversation.