
Oil Moves Below $77.00 While Natural Gas Remains Below $3.00
Oil chart analysis
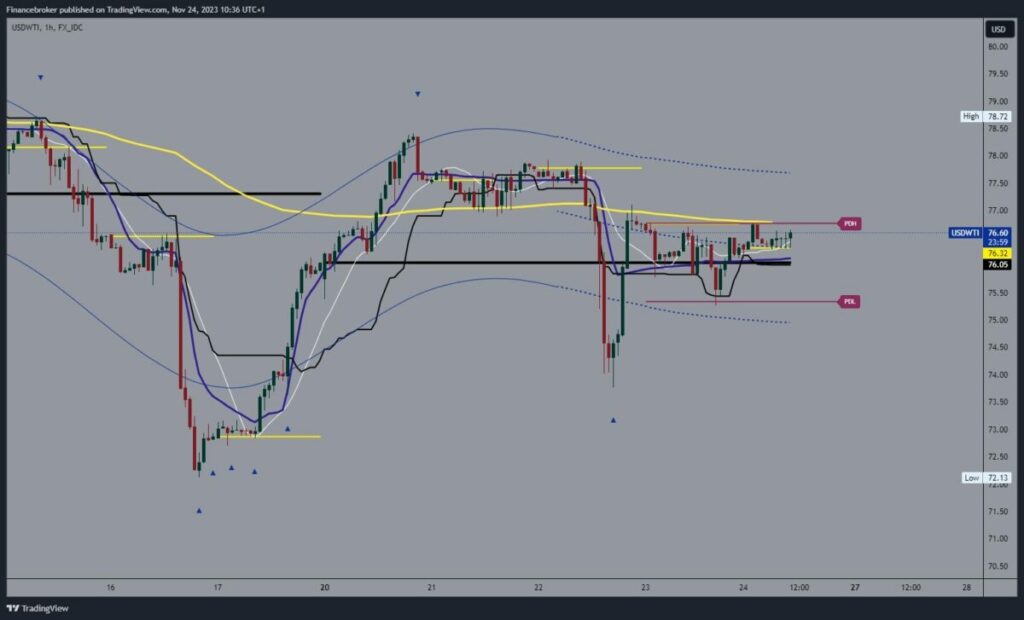
The first part of this week was very turbulent for the price of oil. We held above the $77.00 level on Monday and Tuesday, only to see bearish consolidation and a drop to the $74.00 support level on Wednesday. We managed to get support at that level and start a recovery to the $77.00 level. There, we encounter the EMA50 moving average, which for now represents additional resistance in the zone around the $77.00 level.
Thursday is the first day of Thanksgiving, and there is a decrease in market volatility, and the price of oil moves in the $75.00-$77.00 range. We spent most of this consolidation near the upper level, which could cause a breakout above and a continuation to the bullish side next week. Potential higher targets are $77.50 and $78.00 levels.
(Click on image to enlarge)
Natural gas chart analysis
On Wednesday, we saw a drop in the price of natural gas to the $2.82 level, where we formed a two-month price low. We managed to get support at that level and start a recovery to the $2.95 level. We encounter new resistance in that zone and start a new pullback to the $2.88 level. Now, we are again on the way to fall below $2.85 and visit the previous low. Potential lower targets are $2.80 and $2.75 levels.
We need positive consolidation and growth above the $3.00 level for a bullish option. Thus, we would jump above the EMA50 moving average, which could then provide us with support for the continued bullish side. Potential higher targets are $3.05 and $3.10 levels.
(Click on image to enlarge)

More By This Author:
EURUSD Holds At 1.09200 While GBPUSD Jumps To 1.25600Dogecoin Stabilizes Above 0.07500 And Shiba Above 0.00000800
Solana Is On His Way To 60.00 And Cardano Stopped At 0.390
Disclaimer: Finance Brokerage and its workforce cannot, and do not, absolute warrant the accuracy, relevancy, reliability, consistency, and completeness of any information and materials in the ...
more

