Oil Is Stable, While Natural Gas Slips Below $2.30 Level
Oil chart analysis
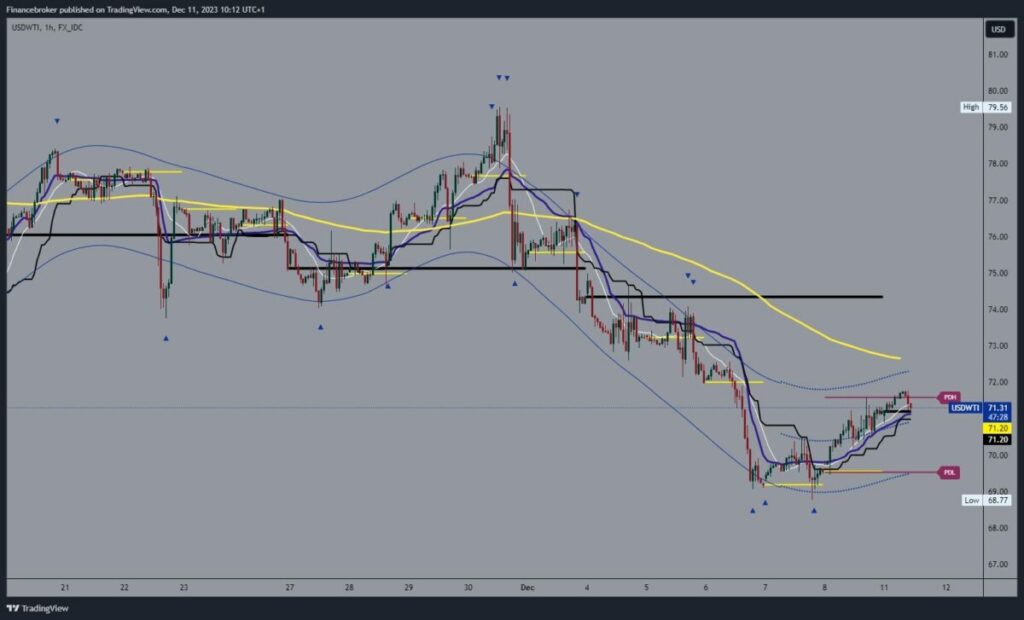
The price of oil is in a three-day bullish trend from the previous low to the $68.77 level. During the Asian trading session, we saw a continuation of the bullish consolidation and a move up to the 71.80 level. We stop at that level and begin a pullback to the $71.20. The oil price has been under pressure in the past few hours, which could influence us to see a further retreat to last week’s support levels. Potential lower targets are $71.00 and $70.00 levels.
For a bullish option, we need price growth above the $72.00 level. After that, a positive consolidation and movement to the $73.00 level is needed. This would allow us to jump over the EMA50 moving average and get its support to continue to the bullish side. Potential higher targets are $74.00 and $75.00 levels.
(Click on image to enlarge)

Natural gas chart analysis
At the beginning of this week, the price of natural gas continued its bearish retreat to the $2.26 level. We broke below last week’s low and thus formed a new one. Currently, we got the desired support, which moved the price to the $2.29 level. We need a continuation of positive consolidation and a move above the $0.30 level if we want to see a recovery in the price of natural gas.
Potential higher targets are $2.35 and $2.40 levels. We need a negative consolidation and a break below the previous low for a bearish option. This would lead to the formation of a new low, and thus, we would get confirmation of the bearish pressure on the price of natural gas. Potential lower targets are $2.25 and $2.20 levels.
(Click on image to enlarge)

More By This Author:
Bitcoin Up To $40659 And Ethereum Up To $2145 This Morning
EURUSD Is Above 1.0760 And GBPUSD Is Hovering Around 1.2550
Bitcoin Falls Below $43500, While Ethereum Jumps To $2392
Disclaimer: Invezz is a place where people can find reliable, unbiased information about finance, trading, and investing – but we do not offer financial advice and users should always ...
more


