
Oil In The $85-$87 Range, Natural Gas Is Making A Pullback
Oil chart analysis
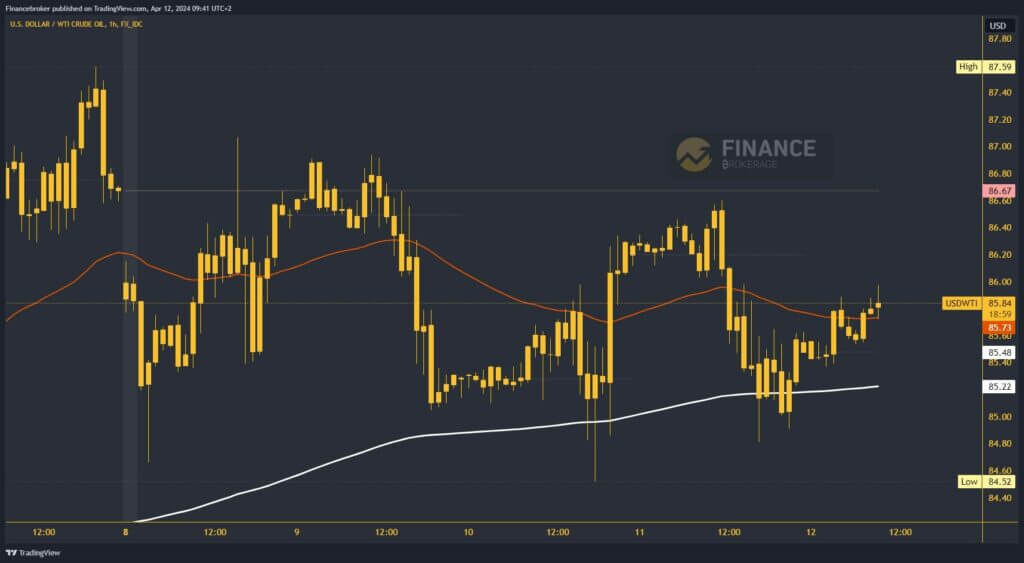
This week, the oil price was in the $85.00-$87.00 range. Last night, we were again at the lower level of this channel, and since then, we have been in a bullish consolidation, moving towards the upper level. We are now midway around $86.00 and expect to see a continuation to the $87.00 level. Here, we test the EMA50 moving average and hope for its support for the continued bullish side.
Potential higher targets are $86.20 and $86.40 levels. We need a negative consolidation and pullback down to the $85.00 support level for a bearish option. Additional support in that zone is the EMA200 moving average. Failure to hold above will force us to drop below to a new low. Potential lower targets are $84.80 and $84.60 levels.
(Click on image to enlarge)
Natural gas chart analysis
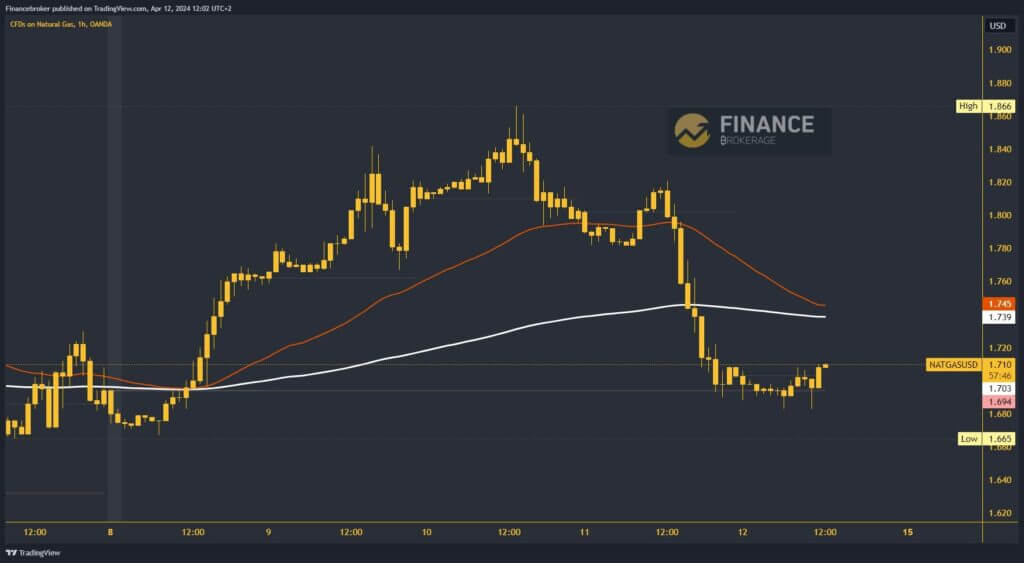
The price of natural gas has been in a bearish trend for two days, and this morning it fell to the $1.68 level. A stronger pullback was initiated yesterday from the $1.82 level. During the Asian session, we fell to a new low, and for now, we have managed to stay above that level. The price rose to $1.70 in a short, bullish consolidation. We expect to see a continuation of this consolidation and the price of natural gas to a new daily high.
Potential higher targets are $1.72 and $1.74 levels. In the zone around $1.74, we come across the EMA200 moving average. For a bearish option, we need a continuation of the consolidation below the $1.68 level. With that, we go to a new weekly low and thus get confirmation that we remain under negative pressure and can expect a further pullback. Potential lower targets are $1.66 and $1.64 levels.
(Click on image to enlarge)
More By This Author:
2024’s Commodity Boom: Is History Repeating Itself?Dogecoin And Shiba Inu: Dogecoin Resting Below 0.20500
Bitcoin Eyes Halving Milestone Amid Falling ETF Trades
Disclaimer: Information on this article contains forward-looking statements that involve risks and uncertainties. Markets and instruments profiled on this page are for informational purposes ...
more

