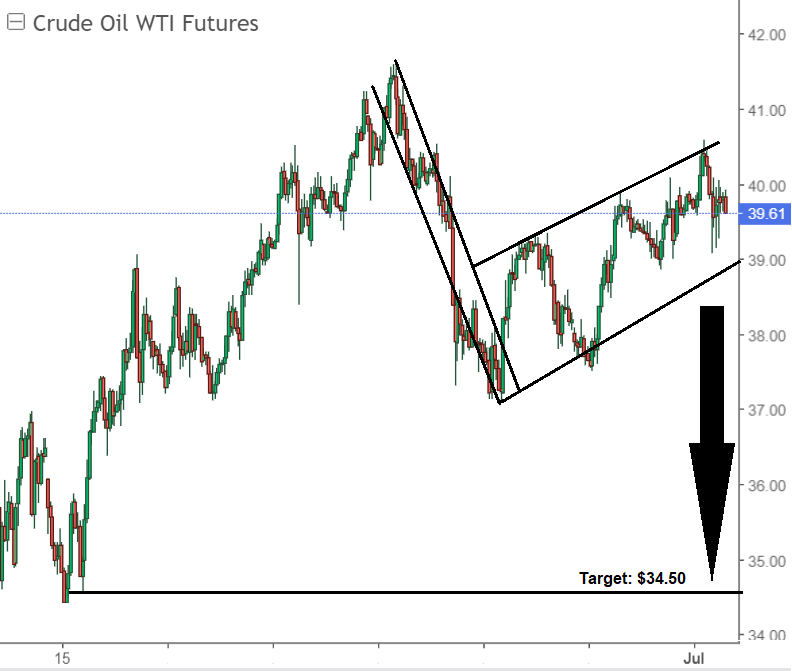
Oil Chart Analysis: WTI Drop To $35/bbl
WTI crude oil has been holding around $40/bbl for the past couple weeks after it topped out at $42/bbl. Based on the technical oil chart analysis, a big fall is coming to $35/bbl or lower. There is a classic inside bar/bear flag formation that signals a swift flush on WTI crude. The drop will likely occur before July 15th. In fact, it likely will begin its drop by early next week. The oil analysis is clear, bear flag, and a cycle time count coming to a head should have investors and commodity traders shorting oil here.
(Click on image to enlarge)

Disclosure: None.


The entire arena of futures trading really needs to be tightly regulated and kept under a good microscope. In particular, the use of leverage and credit in general should be brutally limited. Oil speculation in all forms is damaging to everybody else. We saw that a few years back when gasoline went to $4 per gallon. We all suffered at the hands of the speculators, didn't we?