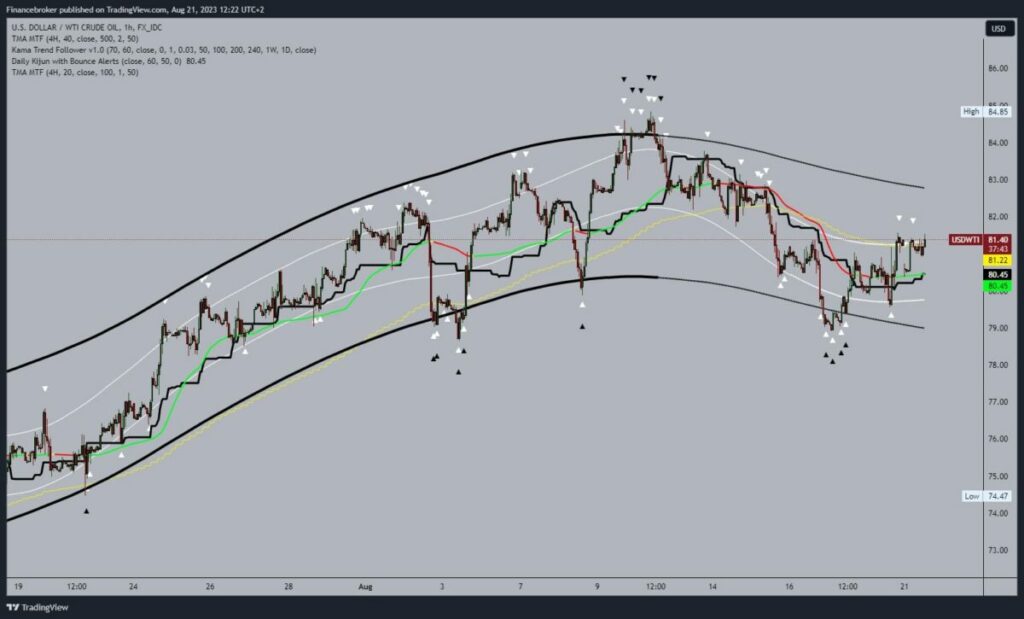
Oil And Natural Gas: Oil Is Looking For Support At $81.00
Oil chart analysis
In the Asian session, we saw a bullish impulse, pushing the oil price to $82.00. This is where we encounter resistance and see a pullback to the $81.00 level. A bearish impulse preceded this drop, and we are now looking at where the price could find new support. If the current bearish impulse continues, the price should slide to the $80.00 level. Potential lower targets are $79.00 and $78.00 levels.
We need a positive consolidation and a jump to the $82.00 level for a bullish option. We would get additional support in the EMA50 moving average by crossing above the $81.50 level. After that, a breakthrough above the previous low is needed and an attempt to maintain it up there. Potential higher targets are $83.00 and $84.00 levels.
(Click on image to enlarge

Natural gas chart analysis
During the Asian trading session, the price of natural gas recovered above the $2.55 level. On Friday, we saw a drop and pullback to the $2.50 level, where the price managed to gain support, consolidate and start a recovery. Today’s high price is $2.62, and we continue to move above the $2.60.
Potential higher targets are $2.65 and $2.70 levels. Additional resistance of the bullish option price could be found in the EMA50 moving average around the $2.65 level. We need a negative consolidation and pullback below the $2.55 level for a bearish option. After that, we would be in a position to hit the $2.50 support level again. A break below would form a new low and thus confirm the bearish side. Potential lower targets are $2.45 and $2.40 levels.
(Click on image to enlarge)

More By This Author:
Unraveling China’s Economic ConundrumBitcoin And Ethereum: Bitcoin Is Still At The $26000 Level
The Dollar Index Is Falling From Last Week’s High To 103.68
Disclaimer: Finance Brokerage and its workforce cannot, and do not, absolute warrant the accuracy, relevancy, reliability, consistency, and completeness of any information and materials in the ...
more


