Oil And Natural Gas: Oil Is Back Above The $70.00 Level
Oil chart analysis
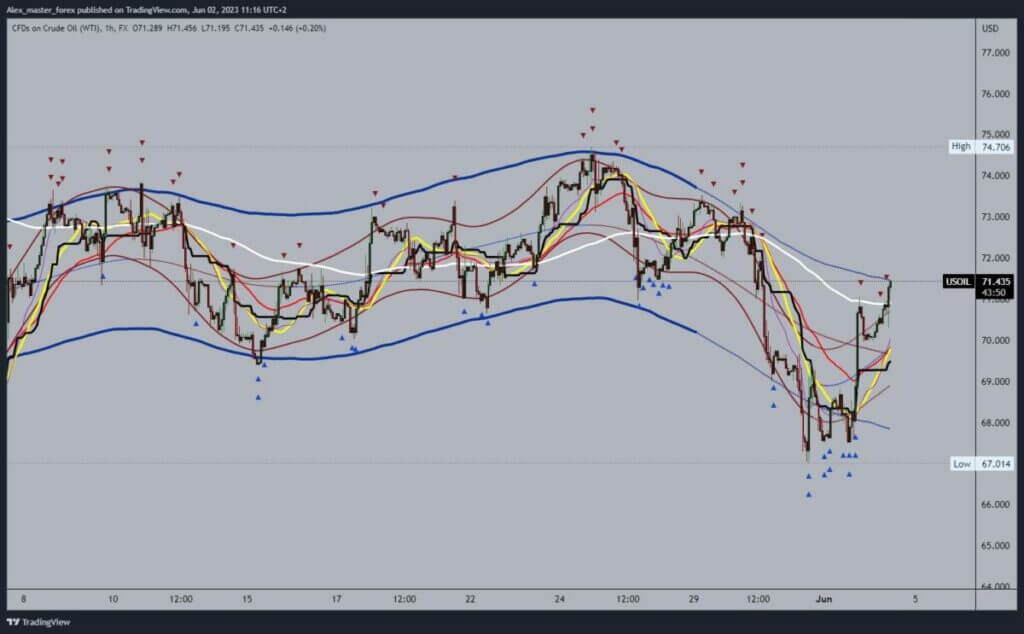
The oil price has returned above the $70.00 level after pulling back earlier in the week. During the Asian trading session, the price started a bullish consolidation and crossed above the $71.00 level. We are now on our way to $71.50 and could test that level soon. A break above would mean a potential further continuation to the bullish side.
Potential higher targets are the $72.00 and $73.00 levels. We need a negative consolidation and pullback to the $70.00 support level for a bearish option. If we slip below, the potential lower targets are the $69.00 and $68.00 levels, as well as this week’s low at the $67.00 level.
(Click on image to enlarge)

Natural gas chart analysis
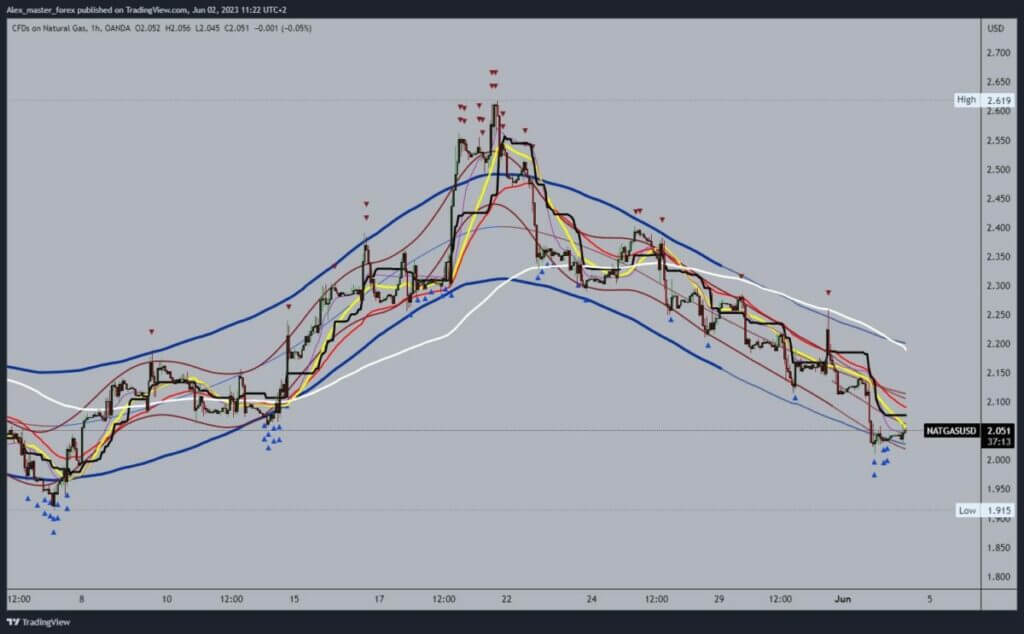
Yesterday we saw the gas price pull back to the $2.00 level. During the Asian trading session, the gas price did not recover much, and the current price is $2.05. Based on today’s consolidation, we could expect to see continued price recovery. Potential higher targets are the $2.10 and $2.15 levels.
In the zone around the $2.15 level, we encounter the EMA50 moving average, which could increase the bearish pressure and send us down again. On the bearish side, potential lower targets are the $1.95 and $1.90 levels.
(Click on image to enlarge)

More By This Author:
Evaluating The Status Of Global Stocks And SharesBitcoin And Ethereum: Bitcoin Slipped Below The $27,000
Asia Stock Market Predictions 2023: Analyzing Opportunities
Disclaimer: Finance Brokerage and its workforce cannot, and do not, absolute warrant the accuracy, relevancy, reliability, consistency, and completeness of any information and materials in the ...
more


