Oil And Natural Gas: Oil Fell After The Weak Data In China
- Oil fell during the Asian trading session after weak data on manufacturing activity in China and concerns that the spread of coronavirus-related restrictions will dampen demand.
- The price of natural gas continues its bullish recovery after finding support at the $5.00 level on Friday.
Oil chart analysis
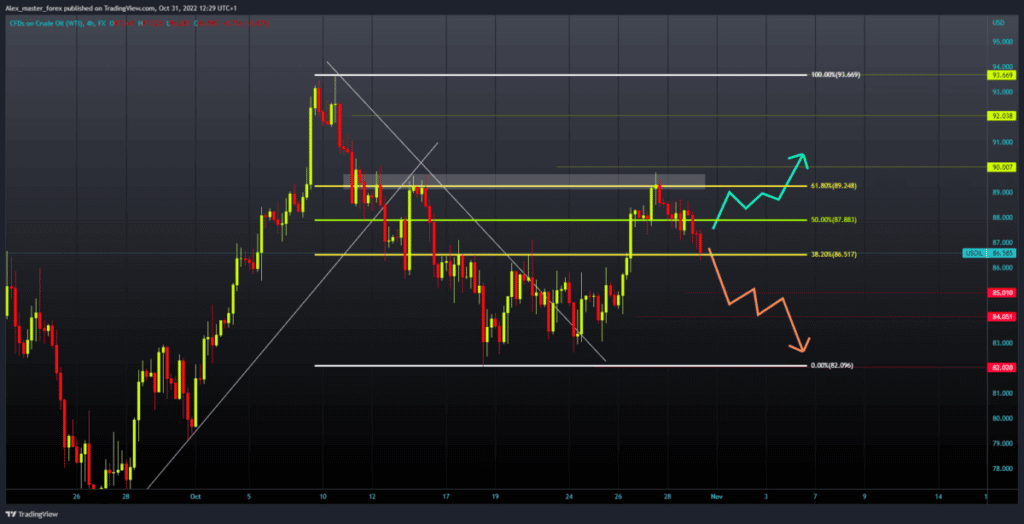
Oil fell during the Asian trading session after weak data on manufacturing activity in China and concerns that the spread of coronavirus-related restrictions will dampen demand. Today’s low price is at the $86.40 level. We need a negative consolidation and a continuation of the oil price decline for a bearish option. The price could first fall below the $86.00 level, and then we could expect to visit the $85.00 level.
A price break below could once again test the previous low at the $84.00 level. For a bullish option, we need a new positive consolidation. Then we need to get support at the current level and move towards the $88.00 level. If we could manage to stay up, we would have a much better chance to move to the $90.00 level with a new bullish impulse. Potential higher targets are the $91.00 and $92.00 levels.
(Click on image to enlarge)

Natural gas chart analysis
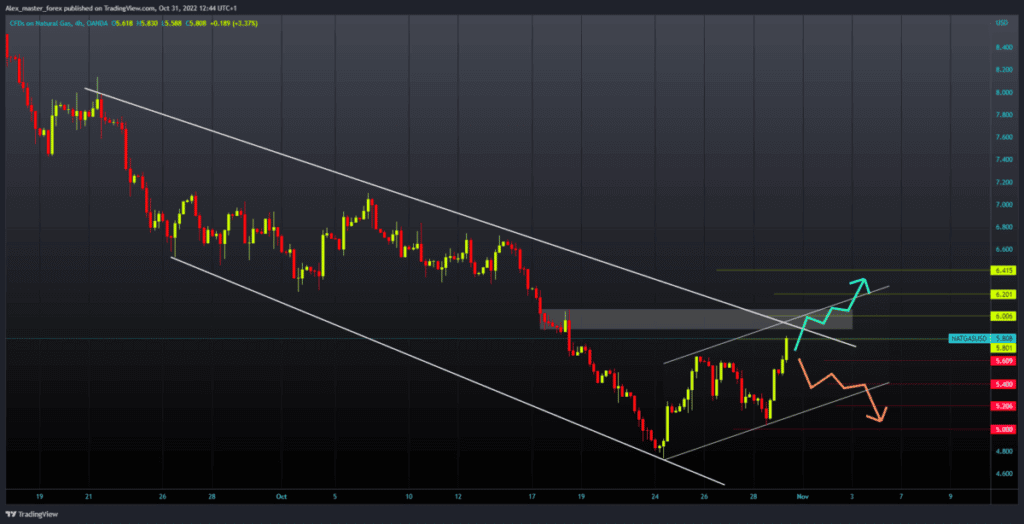
The price of natural gas continues its bullish recovery after finding support at the $5.00 level on Friday. It is important for the price that it made a break above the $5.60 level, and now we are already at the $5.80 level. For a bullish option, we need a continuation of positive consolidation that could push the price to the $6.00 level. Additional resistance at that level is in the upper resistance line.
A break above could form a continuation of the recovery to the next prior high. Potential higher targets are $6.20 and $6.40. We need a negative consolidation and a new price pullback for a bearish option. We could then see a drop to the $5.60 support level. A break below could further lower the price to the previous low at $5.00 and the support line.
(Click on image to enlarge)

More By This Author:
Bitcoin And Ethereum: Bitcoin’s Price Continues To Pullback
The US Dollar Rises From A One-Month Low
Euro And Sterling Hit High While The U.S. Dollar Plunged Low
Disclaimer: Finance Brokerage and its workforce cannot, and do not, absolute warrant the accuracy, relevancy, reliability, consistency, and completeness of any information and materials in the ...
more


