
With the collapse in oil prices since the beginning of the week, we have looked at a few currency pairs and what we can expected from them, including the USD/CAD and the USD/MXN. The Norwegian Krone is an additional currency to be aware of, as Norway is also a large oil-exporting country and the Krone is likely to be affected by the move in oil (among other things).
Before the outbreak of the coronavirus, the Norges Bank had been increasing rates throughout late 2018 and 2019 as Norway’s economy was holding up well amid a global manufacturing slowdown. However, as the coronavirus began to spread, the Norges Bank slashed rates from 1.5%to 1.0% on March 13th. A week later, on March 20th, they cut an additional 75bps to 0.25% as the world came to a near standstill, and liquidity dried up (just as most of the world had done).
Enter crude oil and the collapse in prices over the last month. The correlation coefficient on a weekly timeframe between West Texas Crude Oil (WTI) and USD/NOK is -0.90. This means that 90% of the time, the Norwegian Krone and WTI move together (or 90% of the time, USD/NOK, and WTI trade inversely).
(Click on image to enlarge)
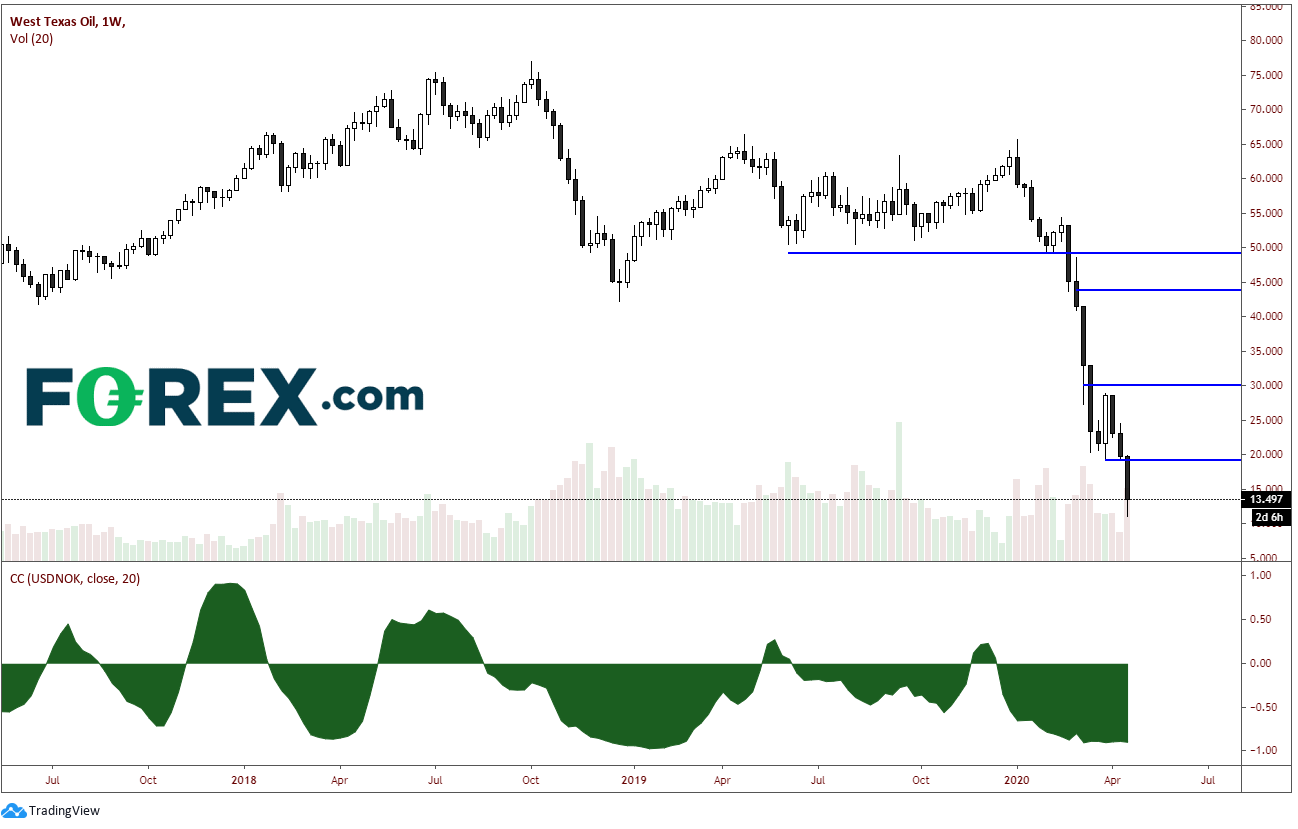
Source: Tradingveiw, FOREX.com
On a daily timeframe, USD/NOK traded higher as crude oil sold of due the Russia/OPEC squabble, in which Russia refused to cut output with the rest of OPEC. As a result, there was no agreement to the production cut, and Saudi Arabia began producing a full throttle. However, as WTI began consolidating in the 20-30 US Dollar range, USD/NOK pulled back to the 61.8% Fibonacci retracement level from the March 3rd lows to the march 19th highs. On Monday, when the May WTI Crude oil contract traded was down over 200%, USD/NOK only moved higher 1.25%.On Tuesday, the June WTI Crude oil contract traded down 50%, USD/NOK was only up 1.81%. And today, as June contract is up 5.81%, USD/NOK is up 1.3% (in the opposite direction one would expect!)
(Click on image to enlarge)
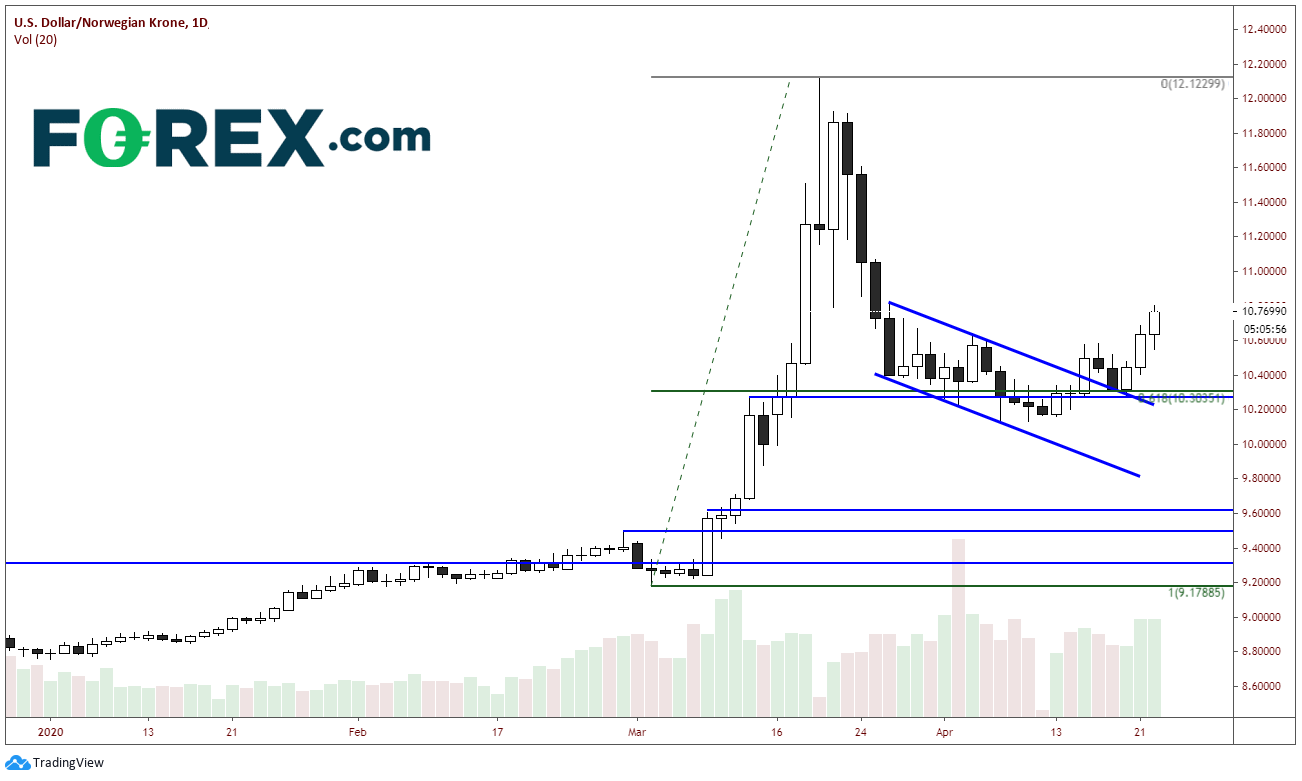
Source: Tradingveiw, FOREX.com
However, on a 240-minute timeframe, notice where USD/NOK is trading: right up against horizontal resistance at 10.77 and just below the 38.2% Fibonacci retracement level from the March 19th highs to the April 7th lows, near 10.8730. If price breaks through, there is horizontal resistance and the 50% retracement from the same period at 10.8730. Horizontal support levels are at 10.4688 and 10.2857, and then the April 7th lows near 10.1000.
(Click on image to enlarge)
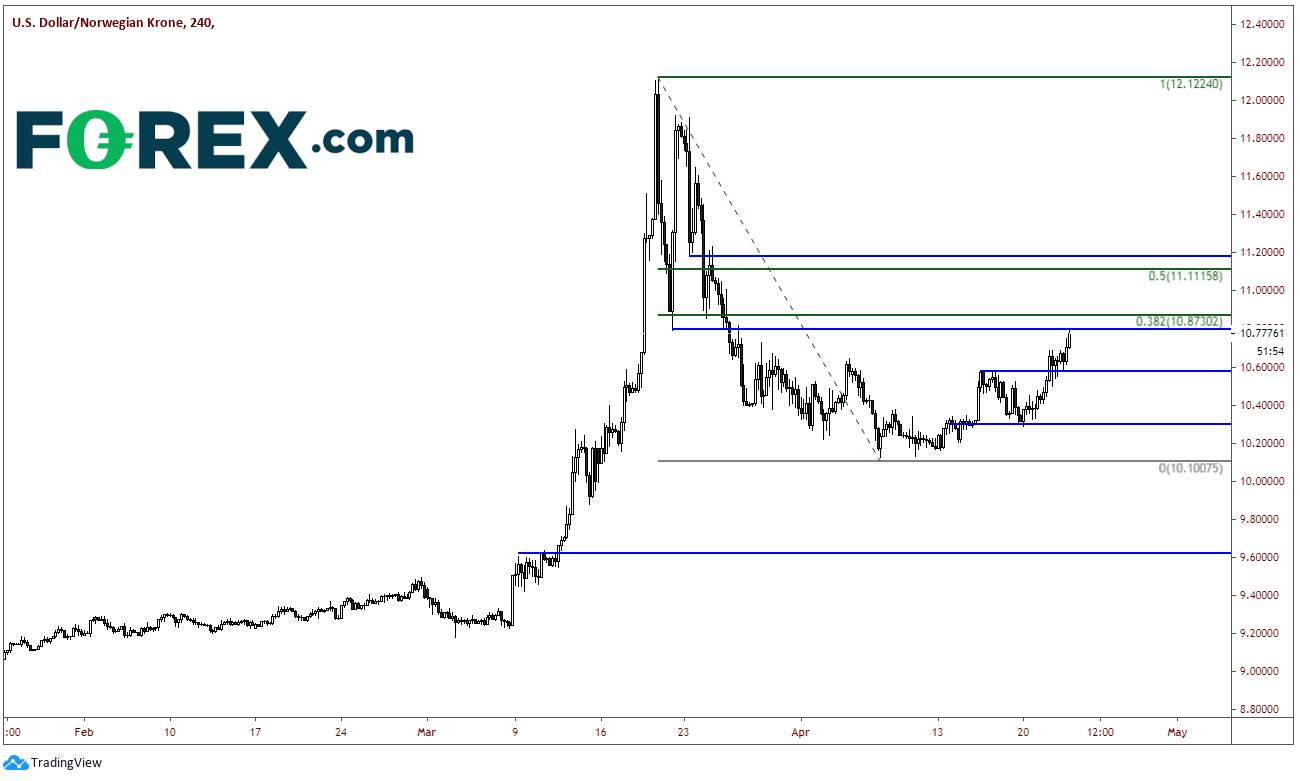
Source: Tradingveiw, FOREX.com
Although WTI Crude Oil may have been trading a but heavy as of late, USD/NOK isn’t believing it, at least in the short-term. However, the bounce in USD/NOK appears to be corrective with good resistance above. If USD/NOK does roll back over, it will have proved correct, and the move lower in crude was just a bit overdone!


Comments
Log in or sign up to join the conversation.