Natural Gas The New Injection Season Begins
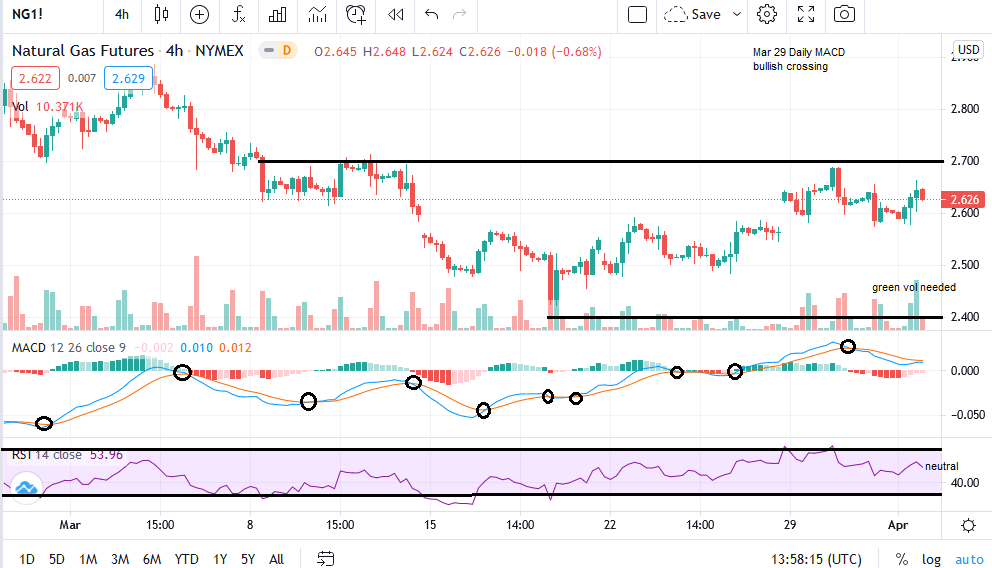
Natural Gas futures on the NYMEX had a volatile week before closing at the same level as the previous one at $2.62 on Friday. EIA reported on Thursday the first injection of the new refill season of 14 Bcf in working underground stocks for the week ended March 26. Total inventory is currently at 1,764 Bcf, 11.3% lower y/y, 2% below the 5-year average, 53% above the 5-year minimum.
The Daily MACD has crossed bullish on a bounce recently as we had anticipated. We now want to see the $2.70 level offering resistance so we can continue trading the post-winter downtrend towards the season's floor. Around $2.25 for the next evident support. We will feel better about this move when the Daily MACD crosses into red again. It might take another couple of weeks.
The Natural Gas market cannot find new buying volumes. The recent $3.40 seasonal ceiling has been offering a nice benchmark all these past months in terms of market participants behavior. The downtrend was quick and aggressive from these highs, spot price touched $2.25 twice in the middle of winter as the 2016 lows are still shaping the overall sentiment. At $3.00 the market offered us another selling opportunity following the blizzards, while January 2022 contract remained flat around $3.00 throughout the winter.
We are still open to selling operations on near term charts but we remain vigilant in identifying a seasonal floor. It might be only a couple of months away.
Demand for U.S. Natural Gas is currently 3.6% lower than a year ago. It is looking way better than it had looked in the beginning of the withdrawal season. Technically Recoverable Resources are at record high. Exports are growing steadily, LNG deliveries at new record, but, the U.S. domestic consumption remains 8.3% lower y/y. Only the industrial sector is looking good. Natural Gas is struggling to maintain its residential, commercial and power generation market shares. The U.S. recovery is looking steady. Unemployment falls to 6%. The housing market is looking good as well. All U.S. macro data and the Dollar Index to be to routinely monitored. Daily, 4hour, 15min MACD and RSI are pointing to entry areas.


Try days or weeks, natural gas has a bad history of selling off fast and going up slow.