Natural Gas Technical Analysis: Price Finds Some Support
Spot natural gas prices (CFDS On Natural Gas) slightly advanced during the recent trading at the intraday levels, to achieve slight daily gains until the moment of writing this report. It went up by 0.02%, to settle at the price of $6.538 per million British thermal units, after rising during yesterday’s trading by 1.18%.
US natural gas futures rose about 3% on Tuesday, after hitting a nearly three-month low in the previous session. Technical recovery was due to expectations of higher gas demand over the next two weeks than previously expected and renewed concerns about potential railway workers' strike. A rail strike could increase gas demand by threatening coal supplies to power plants.
A union representing employees who build and maintain railroad tracks said its members rejected an initial contract deal with a committee representing major US freight railroads.
The increase in gas prices came despite near-record production and forecasts of continued milder-than-normal weather, which will allow utilities to continue pumping more gas into storage than usual in the coming weeks.
Meanwhile, gas was trading at $45 per million British thermal units in Europe and $35 in Asia. Prices in Europe fell to a three-month low of $44.25 on Oct. 7, as LNG imports increased. The strong amount of gas stored in the Northwest has reached more than 90% of capacity, which compares to an all-time high of $90.91 on August 25.
Natural Gas Technical Analysis
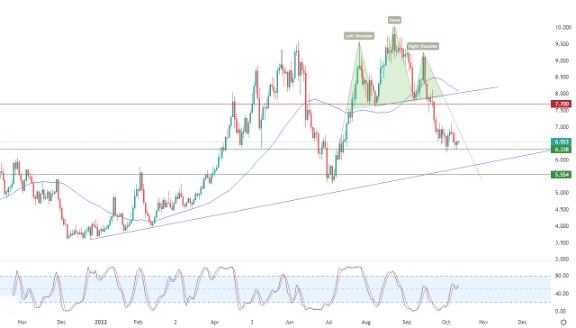
Technically, the price found some support after relying on the pivotal 6.338 support level, this support that we had referred to in our previous reports. The support gained some positive momentum that helped it on this positive rebound, especially with the return of positive signals on the relative strength indicators.
But despite that, the price is still under the influence of a negative technical structure formed earlier in the short term. This is the head and shoulders pattern, as shown in the attached chart for a (daily) period, and it is still suffering from the continuation of negative pressure for its trading below the simple moving average, for the previous 50-day period.
Therefore, our expectations suggest a return to the decline of natural gas during its upcoming trading, especially if it breaks the 6.338 support, and then targets the 5.554 support level.
(Click on image to enlarge)

More By This Author:
EUR/USD Forex Signal: Euro Is Still Ripe For A Bearish BreakoutGBP/USD Forex Signal: Sterling At Risk Of Further Weakness
EUR/USD: Weekly Forecast 9th – 15th October
Disclosure: DailyForex will not be held liable for any loss or damage resulting from reliance on the information contained within this website including market news, analysis, trading signals ...
more


