
Natural Gas Rallies On Colder Temperature Outlook, EIA Report In Focus
An updated temperature forecast from the National Weather Service’s Climate Prediction Center injected some bullish energy into natural gas this week, sending prices nearly 6% higher. The updated outlook shows an increased probability for colder-than-average temperatures across the western United States over the next 8-14 days.
NOAA 8-14 Day Outlook Temperature Probability

Source: NOAA
The heating gas was on track to record a third consecutive month of losses prior to this week’s rally. A relatively mild winter – according to the Midwestern Regional Climate Center – across the United States has likely weighed on demand. Still, the winter season, where natural gas typically sees increased demand, has two months remaining, providing potential time for more weather-induced price rallies.
Data from the US Energy Information Administration has shown historically elevated inventory levels this season. However, the latest EIA Weekly Natural Gas Storage Report for the period ending January 15 reflects an improving situation, with levels continuing to trend closer to the 5-year average following a weekly 187 Bcf inventory decrease. The next EIA report will cross the wires on January 28, according to the DailyFX Economic Calendar. A continuation lower in storage levels may likely spur some upside movement on the report’s release.
EIA Underground Inventory Levels
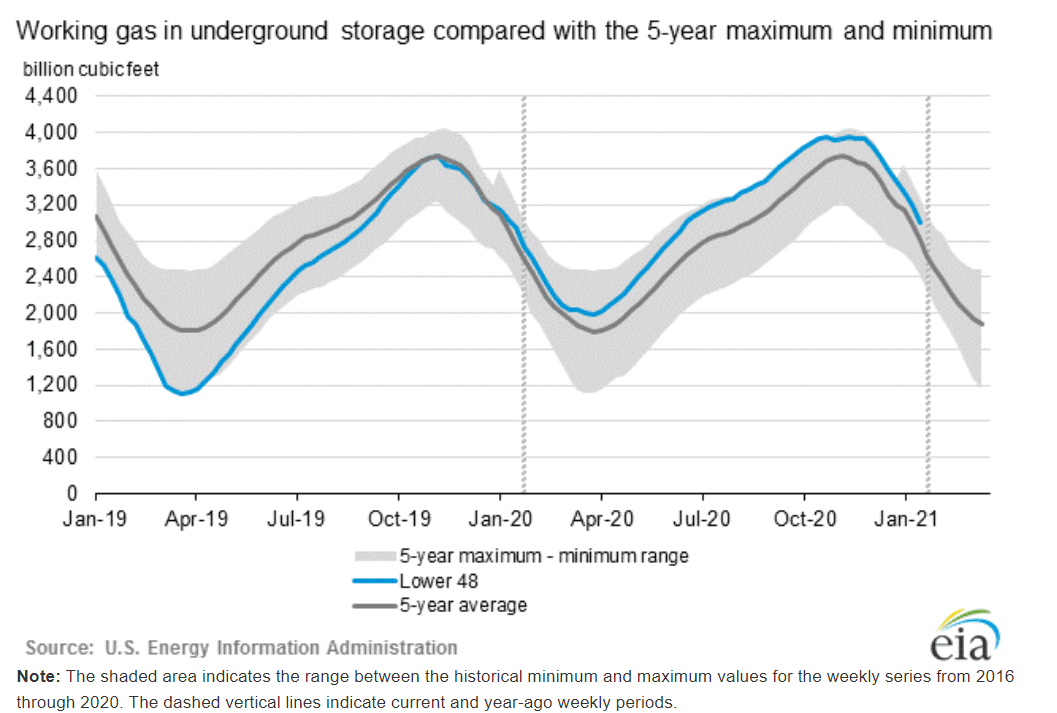
Source: EIA
Natural Gas Technical Outlook:
A break above the 50-day Simple Moving Average this week puts price action on a more stable technical footing. The current move began with a gap up at the start of the week after the 61.8% Fibonacci retracement appeared to underpin last week’s selloff. A small retracement from Wednesday’s high has prices trading just below the 2.7 handle.
A push higher will likely have bulls attempt to break above the 38.2% Fibonacci level, with the January high serving as a subsequent price target at 2.89. The MACD line crossed over its zero line, which may indicate a follow-through in momentum. To the downside, the 50-day SMA may provide some support. A break below could give way to a drop down to the 61.8% Fibonacci level, however.
Natural Gas Daily Price Chart
(Click on image to enlarge)
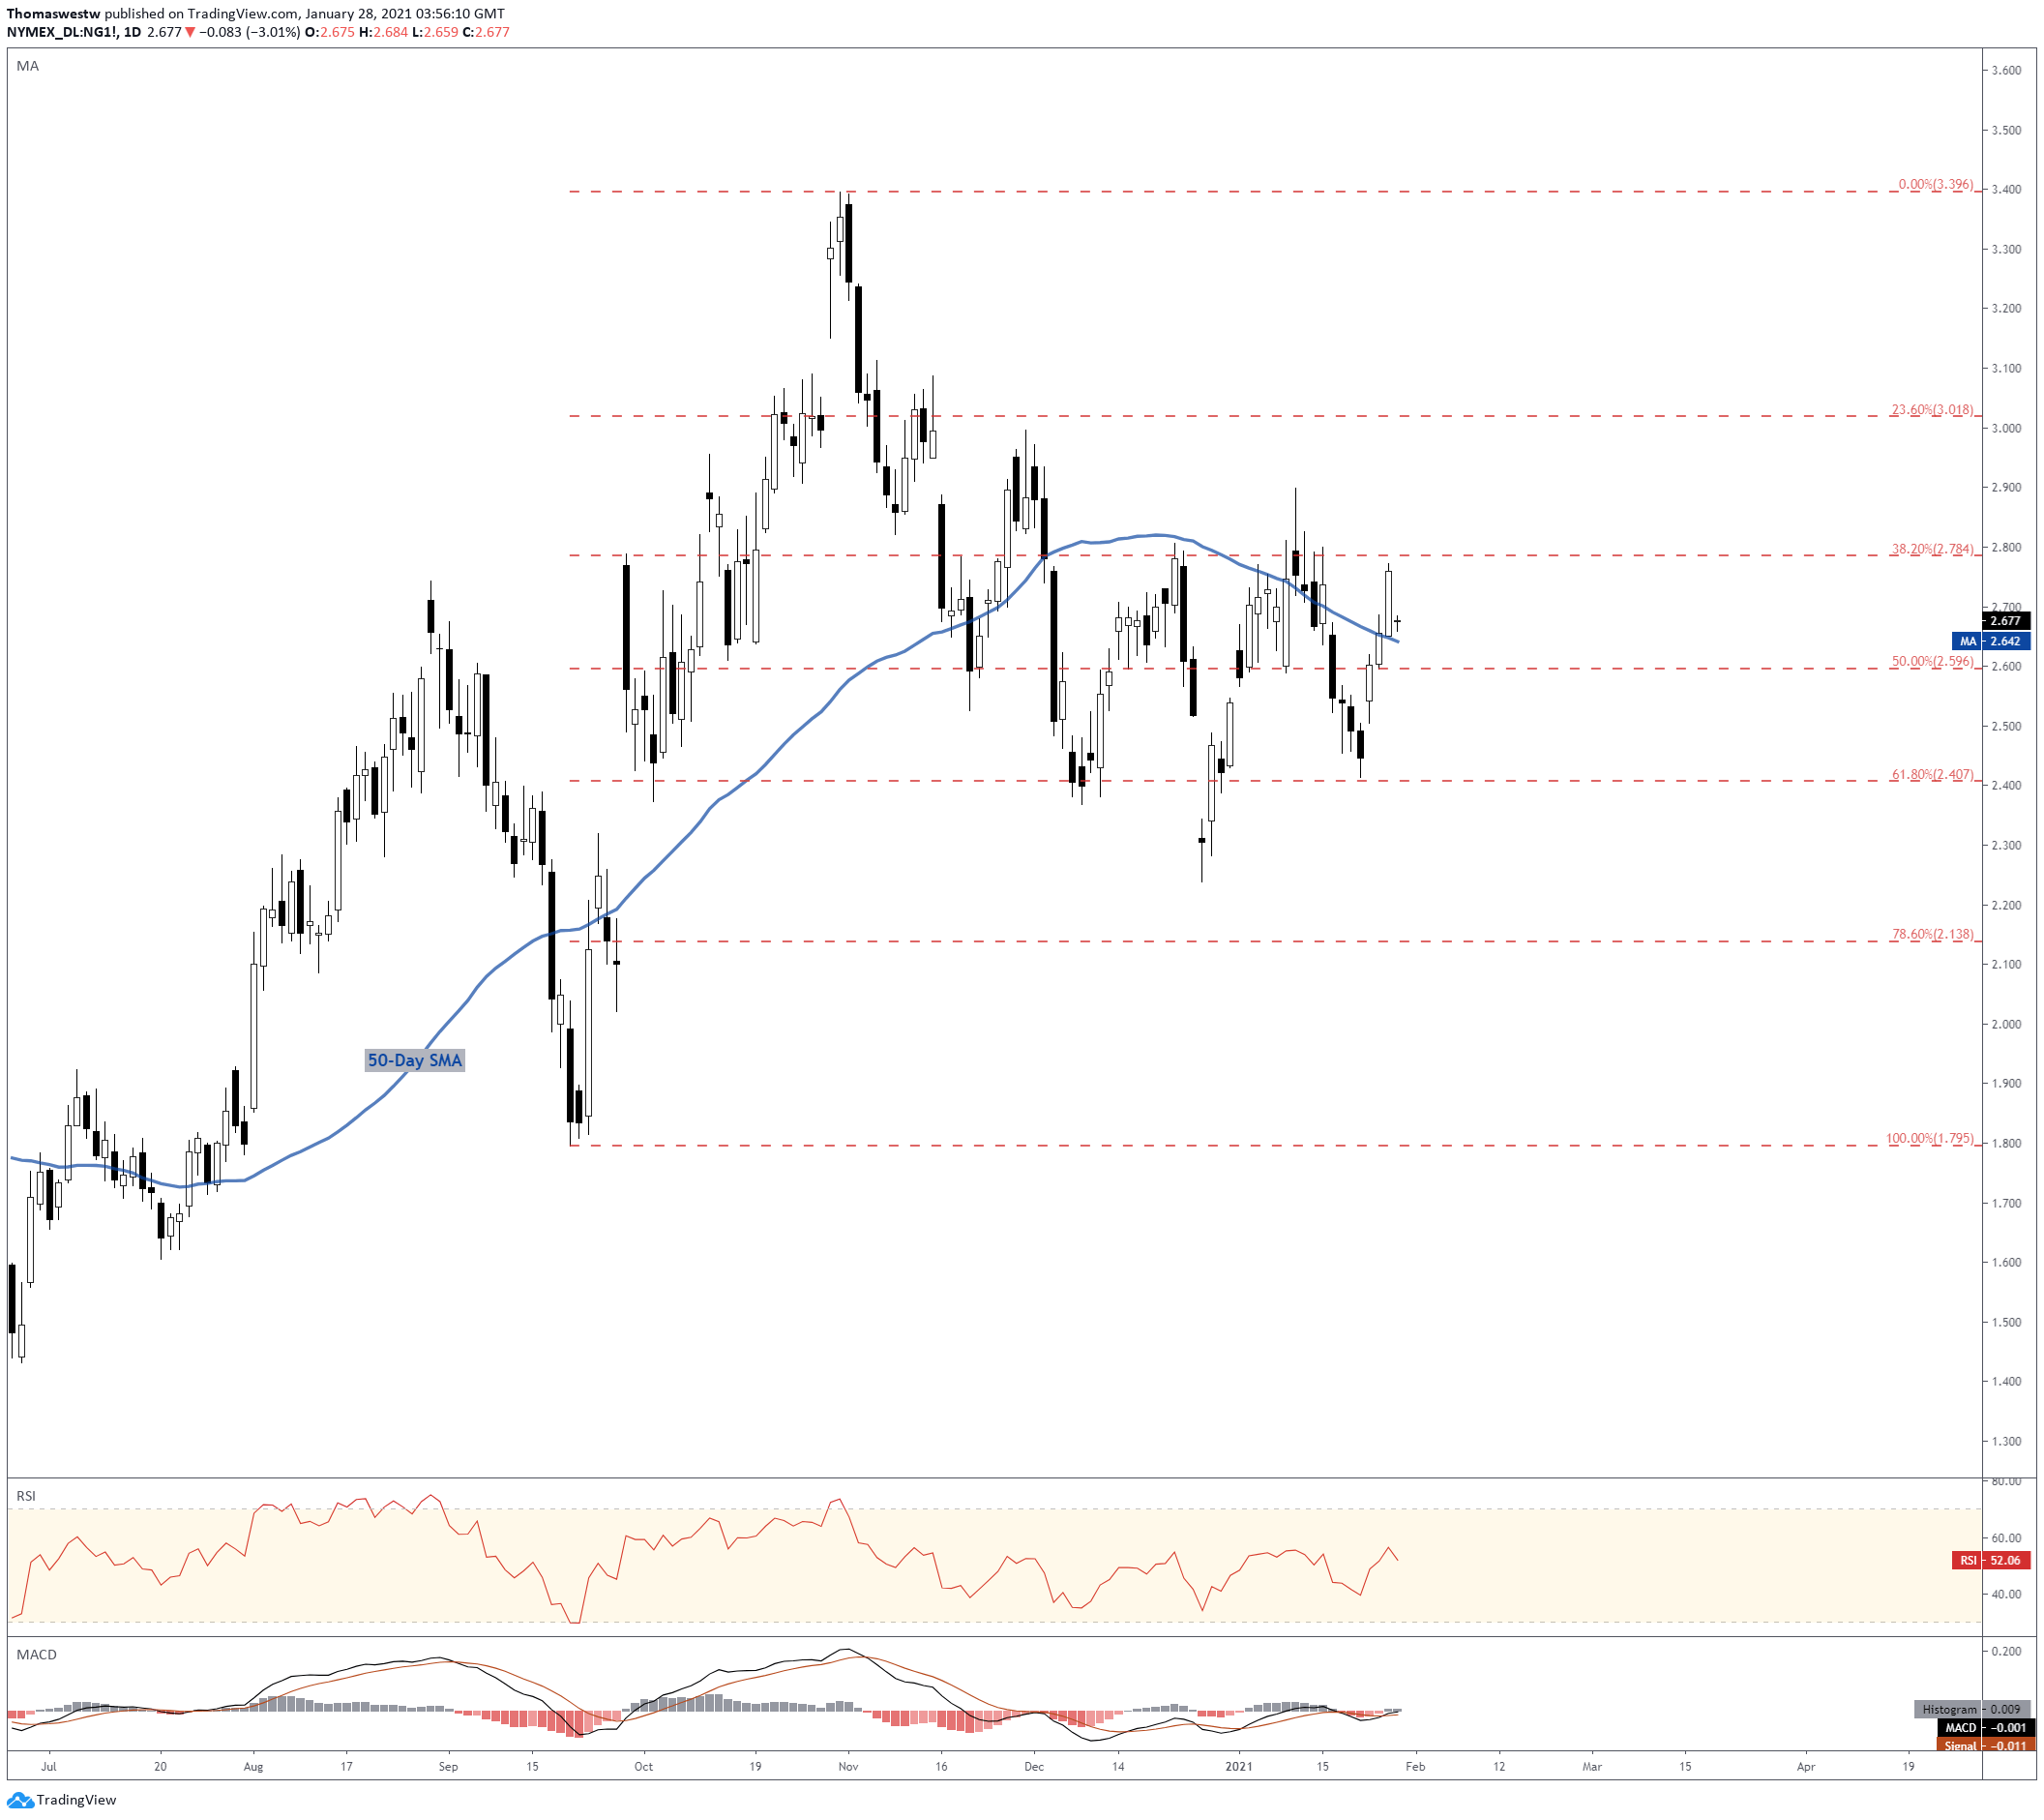
Chart created with TradingView
Disclosure: See the full disclosure for DailyFX here.


