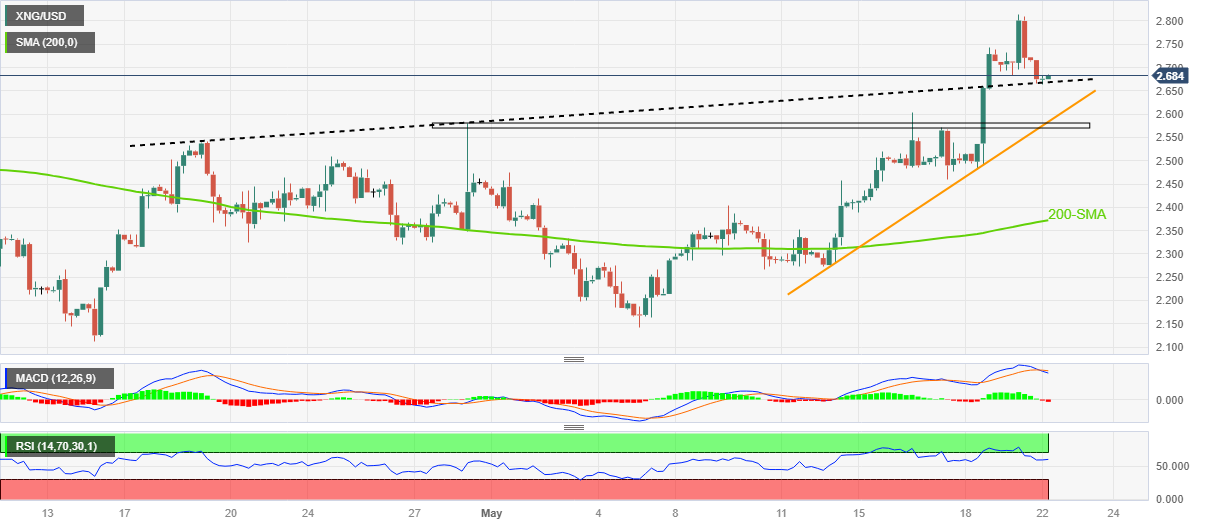
Natural Gas Price Analysis: XNG/USD Prods Resistance-Turned-Support Around $2.66
- Natural Gas price remains pressured after reversing from an 11-week high.
- Bearish MACD signals, RSI’s retreat from overbought territory adds strength to downside bias about XNG/USD.
- Weekly support line, 200-SMA holds the key to the further downside of the Natural Gas Price.
Natural Gas Price (XNG/USD) remains on the back foot around $2.68 as bears attack a short-term key support line, previous resistance, heading into Monday’s European session.
In doing so, the XNG/USD also justifies the bearish MACD signals and the RSI (14) line’s retreat from the overbought region.
As a result, the energy instrument is likely to break the immediate support line of around $2.66.
However, a one-month-old horizontal support zone, surrounding $2.57-58, appears a tough nut to crack for the Natural Gas bears to retake control.
Even so, the 200-SMA level of near $2.37 may act as the last defense of the XNG/USD buyers, a break of which could direct the commodity towards the monthly low of around $2.14.
On the flip side, the Natural Gas price recovery needs validation from the $2.80 ahead of challenging the March month swing high of near $3.08.
In a case where the XNG/USD remains firmer past $3.08, the yearly high of around $4.17 and then the $5.0 psychological magnet will be in the spotlight.
Overall, Natural Gas price is likely to witness a pullback but the trend remains bullish unless the quote drops below $2.57.
Natural Gas Price: Four-hour chart
(Click on image to enlarge)
Trend: Limited downside expected
More By This Author:
Mullen Automotive Stock Forecast: Muln Meets Nasdaq 10-session RequirementGold Futures: Decline Now Appears Contained
EUR/USD Price Analysis: Mid-1.0700s Appear Tough Nut To Crack For Euro Bears
Disclaimer: Information on these pages contains forward-looking statements that involve risks and uncertainties. Markets and instruments profiled on this page are for informational purposes only ...
more


