
Photo by American Public Power Association on Unsplash
- Natural Gas struggles to defend the first daily gains in three inside bullish chart formation.
- Key SMA, impending bull cross on MACD lure XNG/USD buyers.
- Confirmation of falling wedge becomes necessary to convince Natural Gas bulls.
- Sellers have a bumpy road to travel unless breaking $2.14.
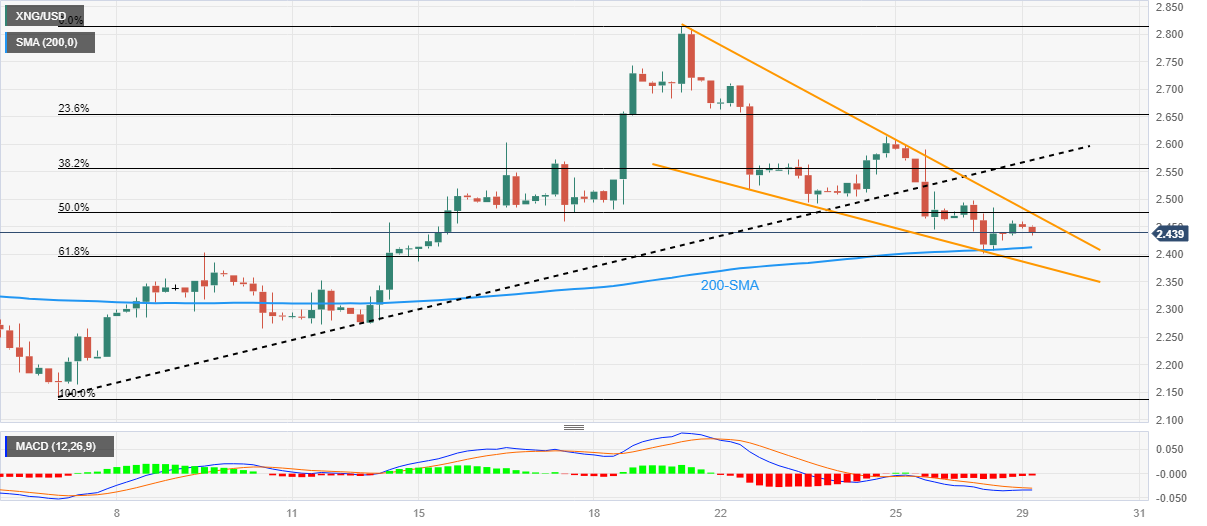
Natural Gas (XNG/USD) Price remains mildly bid around $2.44, recently retreating from the intraday top, during early Monday morning in Europe. In doing so, the XNG/USD struggles to keep the first daily gains in three after snapping the downtrend earlier in the day.
That said, the commodity’s latest weakness could be linked to the inability to keep the bounce off the 200-bar SMA. However, the looming bull cross on the MACD signal and a one-week-old falling wedge bullish chart formation keep the Natural Gas buyers hopeful.
The energy instrument’s latest fall eyes to break the 200-SMA support of $2.41 but the 61.8% Fibonacci retracement level of its early May upside, near $2.39, precedes the stated wedge’s lower line, close to $2.38 at the latest, to restrict short-term downside of the commodity.
Should the XNG/USD defies the bullish chart formation, multiple supports around $2.30-25 and the monthly low of around $2.14 can prod the bears before directing them to the yearly bottom of around $2.11 and then to the $2.00 round figure.
On the flip side, a convergence of the 50% Fibonacci retracement and the wedge’s top line, near $2.48 at the latest, appears the key upside hurdle for the Natural Gas buyers to cross to convince the XNG/USD bulls.
Following that, the previous support line from May 05, close to $2.57 by the press time, could challenge the Natural Gas buyers on their way to the falling wedge confirmation’s theoretical target of around $3.00.
Natural Gas Price: Four-hour chart
(Click on image to enlarge)
Trend: Recovery expected
More By This Author:
NZD/USD Price Action: Bears Are Breaking Down Structure, Eye An ExtensionUSD/JPY Price Analysis: Soars Past 140.00 Despite Weakening US Dollar, Eyes 141.00 Resistance
EUR/USD Battles To Keep The Trade Above The 1.0700 Mark, Looks At US PCE


Comments
Log in or sign up to join the conversation.