
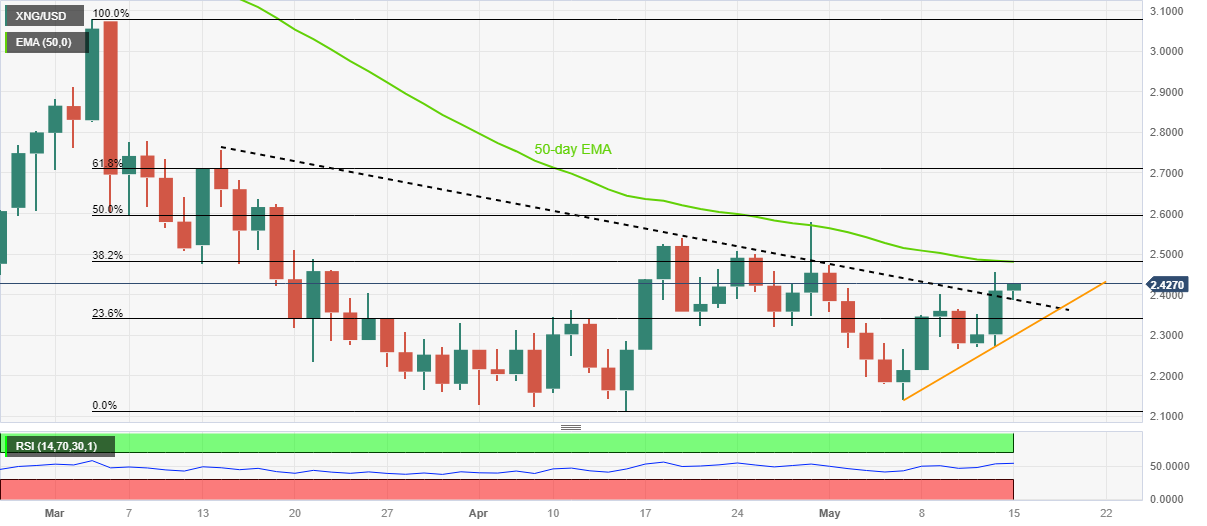
Natural Gas Price (XNG/USD) remains firmer, around $2.42, up for the third consecutive day while flirting with the highest levels in two weeks during early Monday in Europe.
In doing so, the energy instrument cheers the previous day’s sustained break of a downward-sloping resistance line from mid-March, now immediate support near $2.38.
Adding strength to the bullish bias is the RSI (14) line that stays firmer around the 50.00 level, suggesting a continuation of the upward grind.
However, the 50-day Exponential Moving Average (EMA) and 38.2% Fibonacci retracement level of the XNG/USD’s downside from early March to mid-April, near $2.48 at the latest, could challenge the Natural Gas bulls.
In a case where the commodity price manages to provide a daily close beyond $2.48, the odds of witnessing a run-up beyond the previous monthly high of nearly $2.58 can’t be ruled out.
On the contrary, the resistance-turned-support line from March, near $2.38, restricts the immediate downside of the Natural Gas price.
Following that, an upward-sloping trend line from May 05, close to $2.30 by the press time, appears crucial to watch for the XNG/USD bears to watch as a break of which could give back control to them.
Natural Gas Price: Daily chart
(Click on image to enlarge)
More By This Author:
Silver Price Analysis: XAG/USD flirts with $26.00 as 50-DMA prods metal bearsAUD/USD Price Analysis: Corrective Bounce Remains Elusive Below 0.6700
EUR/USD Licks Its Wounds Around 1.0850 With Eyes On Eu Economic Projections, Us Debt Ceiling Talks


Comments
Log in or sign up to join the conversation.