
Natural Gas Forecast: Technical Breakdown May Accelerate As Fundamentals Wane
The most recent 8- to 14-day temperature outlook from the National Weather Service’s Climate Prediction Center paints an unfavorable picture for natural gas prices. Forecasted temperatures in the northeastern and western portions of the United States will be above average over the next two weeks. The south will likely be cooler than normal. Overall, the expected warmer weather – especially across the northeastern US – will likely weigh on demand, driving natural gas prices lower.
NOAA 8-14 Day Outlook Temperature Probability
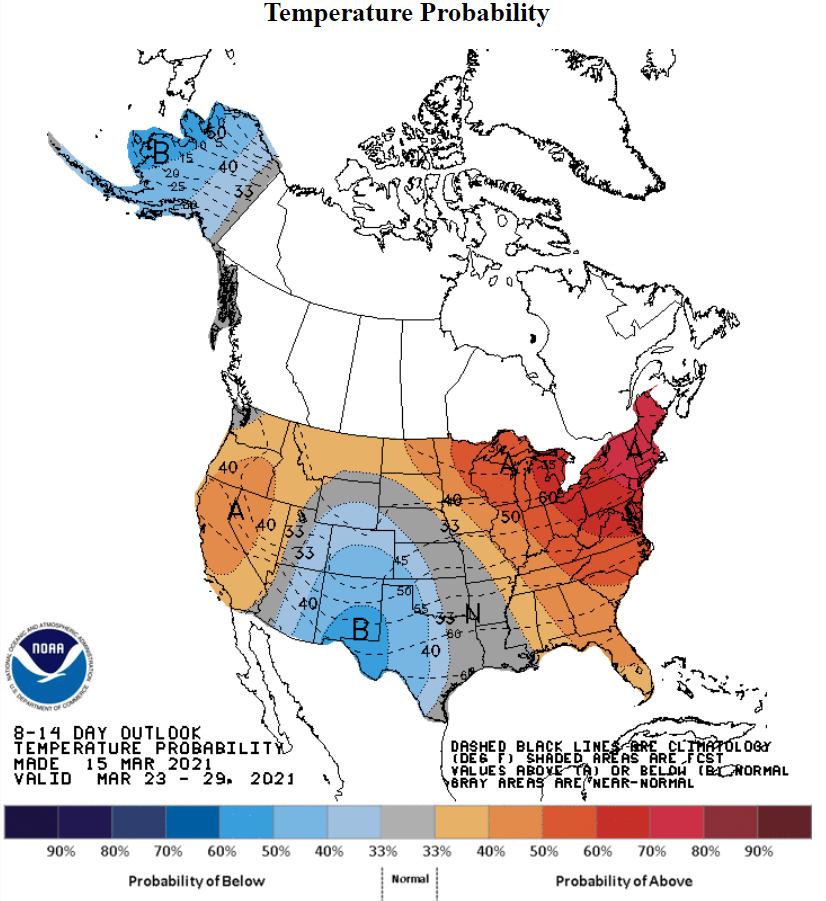
Source: NOAA
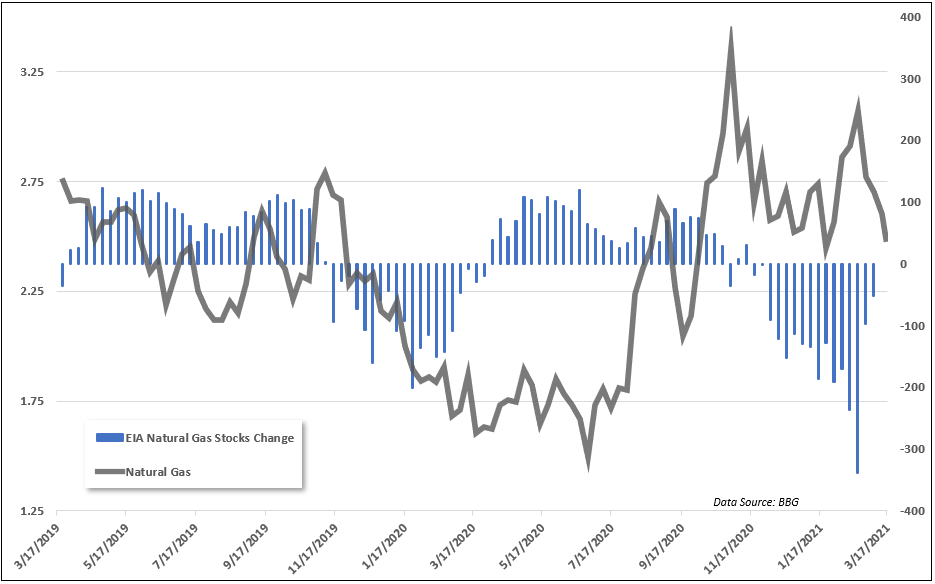
With spring quickly approaching in the United States and warmer weather along with it, natural gas prices may come under increased pressure as the heating gas faces decreased demand prospects. Analysts are expecting a draw of only 21.67 billion cubic feet (bcf) for this week’s EIA storage change, according to Bloomberg’s median forecast. That compares to a 52 bcf draw for the week prior.
That said, even if warmer weather doesn’t manifest this week as the NOAA’s forecast lays out, natural gas prices face decreased demand going into the summer. While late-season storms or unusual cold spells across the United States remain possible, bullish sentiment appears to be on the backfoot as prices continue to move lower. A fundamental shift will need to see a significant shock to supply or demand if prices are to move higher.
EIA Natural Gas Stocks Weekyl Change Versus Natural Gas Price
Natural Gas Technical Forecast
Prices have broken below a key trendline from the September swing lower earlier this week, severely degrading natural gas’s technical posture. The 23.6% Fibonacci retracement from the October to December move was decisively breached on the violent downside move. The total move from the February swing high is now at 25%.
The 200-day Simple Moving Average (SMA) – which sits within 2% of current prices at 2.445 – is now in focus for a potential area for bulls to defend. MACD is oriented lower with a bearish tilt while the Relative Strength Index (RSI) hovers just above oversold territory. If the 200-day SMA breaks, more losses may be in store. Alternatively, a short-term bounce of the key SMA would be unsurprising, but watch for any bounce to fade given the fundamental backdrop.
Natural Gas Daily Chart
(Click on image to enlarge)
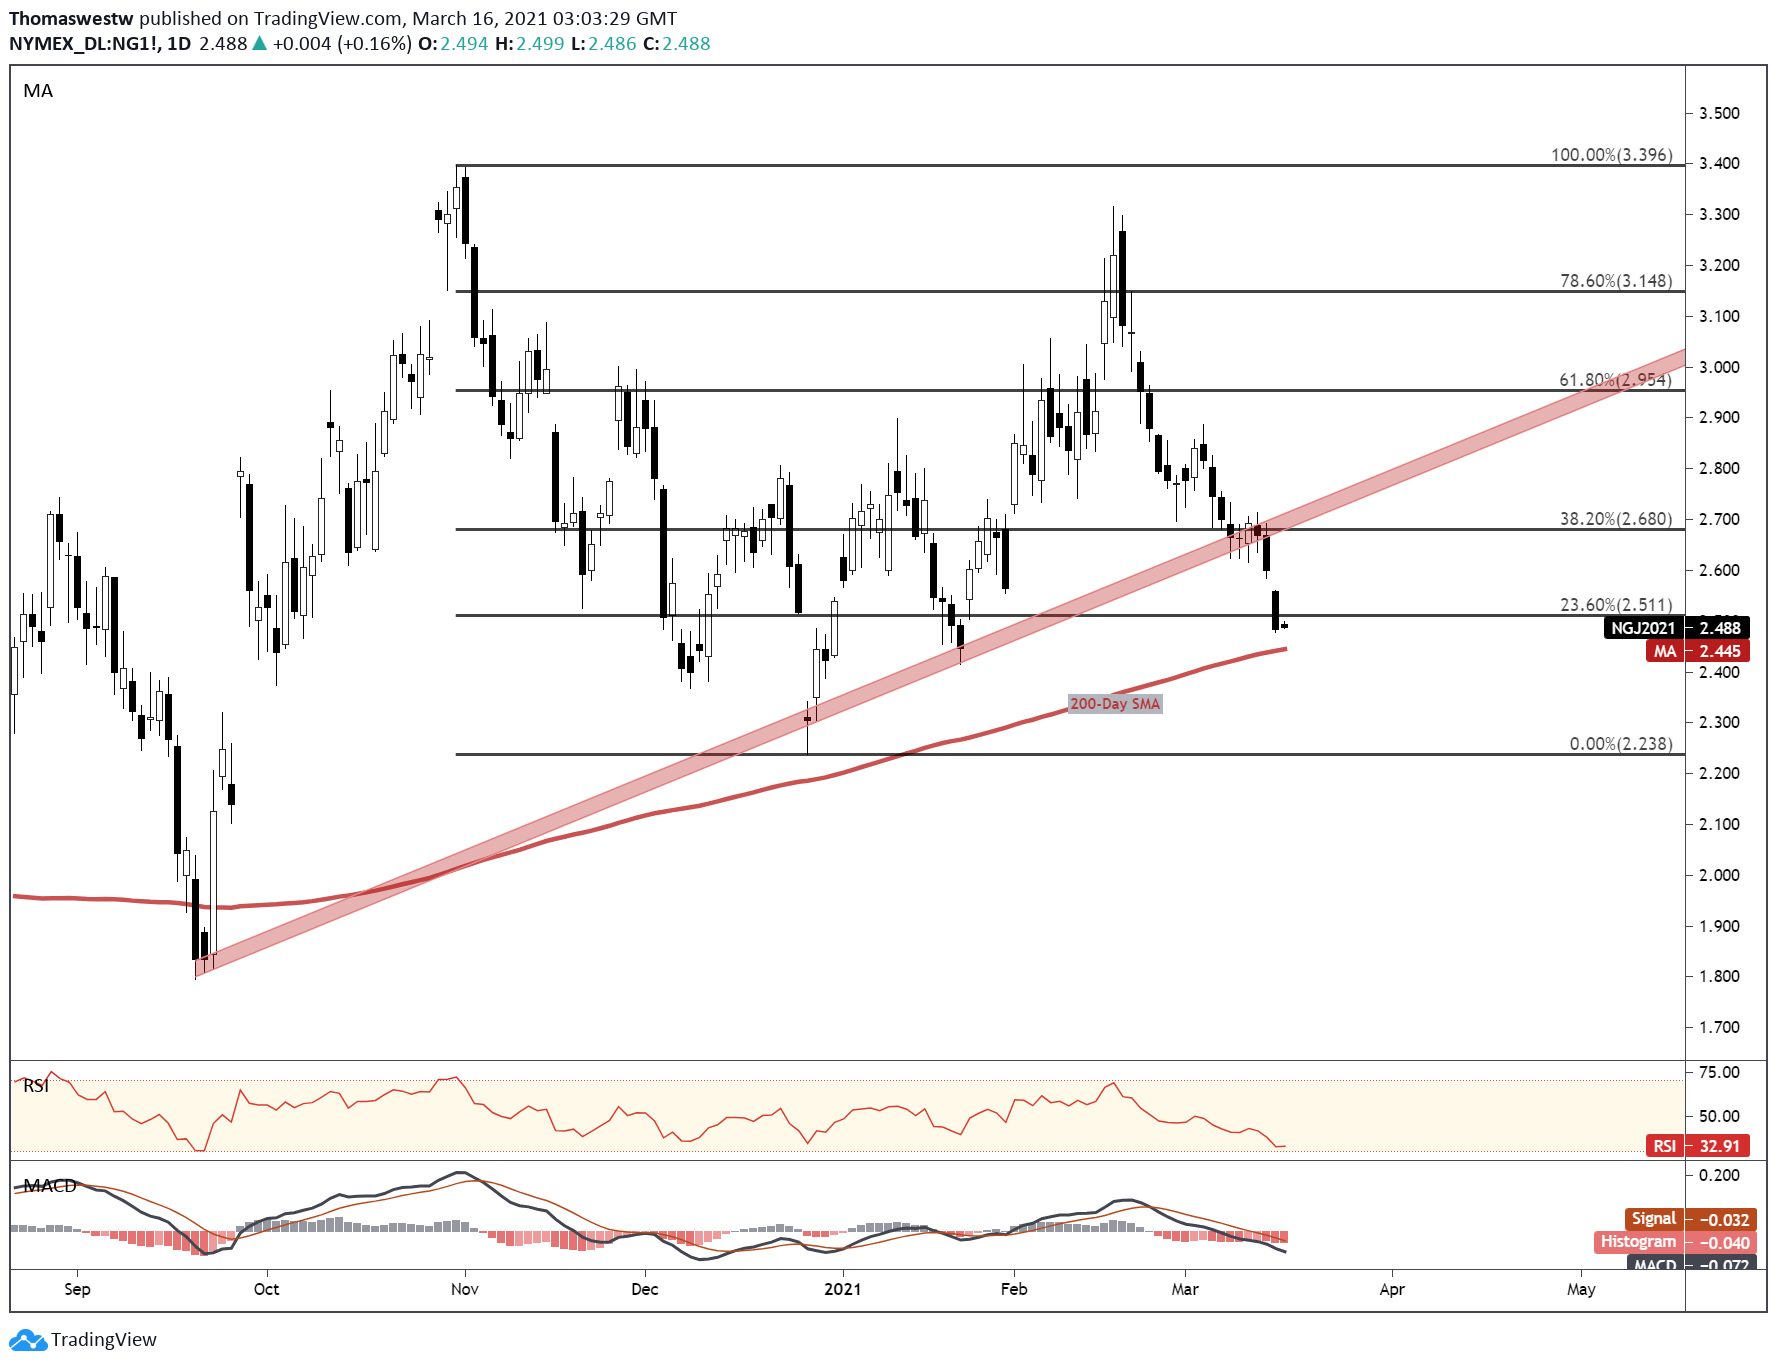
Chart created with TradingView
Disclosure: See the full disclosure for DailyFX here.


