
Natural Gas ETF Breaks Out Fueled By Seasonal Strength
(Click on image to enlarge)
Just two weeks ago, I shared a breakout setup for Natural Gas and wondered, “Is It Time For Natural Gas ETF To Head Much Higher?”
That question is being answered this week, as the Natural Gas ETF (UNG) has surged and broken out to new multi-week highs.
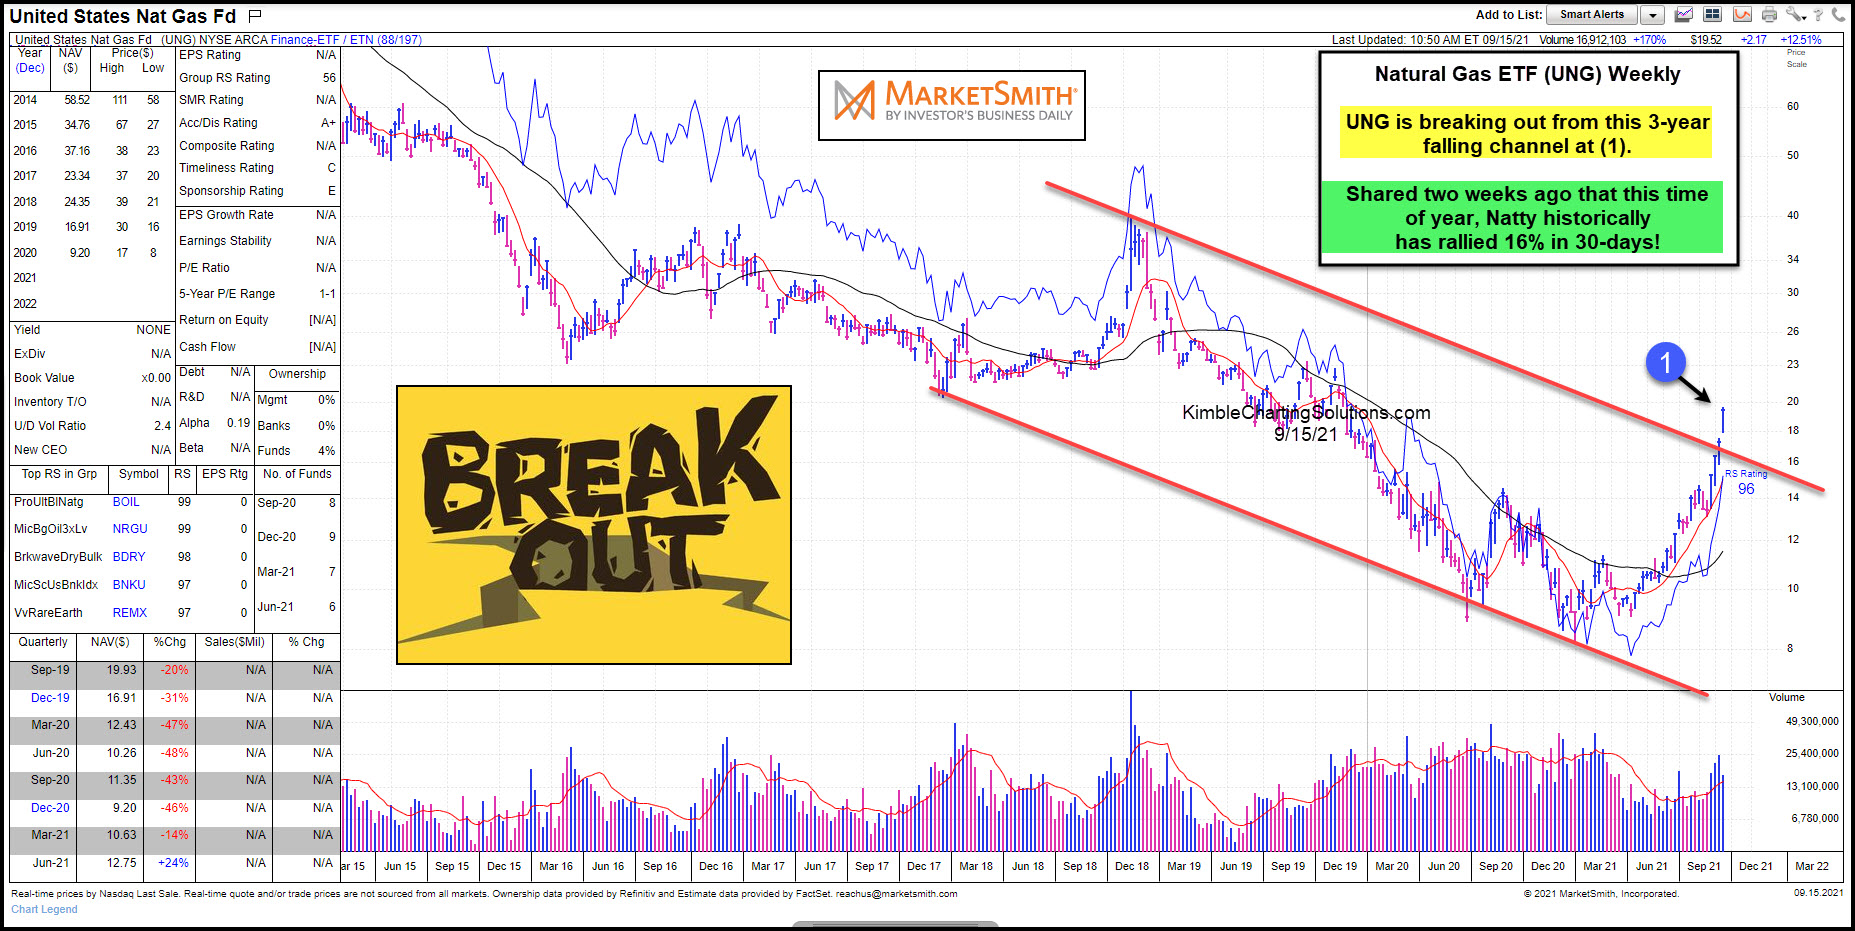
Today’s “weekly” chart is a follow up to our recent article. As you can see in this chart from Marketsmith.com, UNG is breaking out from its 3-year falling channel at (1).
As mentioned two weeks ago (with UNG trading at $16), Natural Gas has historically rallied 16% during its September window. UNG is now trading at $20, or up $25% since the post of 2-weeks ago!
And by the looks of this chart, UNG could be headed higher yet! Stay tuned!
Disclosure: Sign up for Chris's Kimble Charting Solutions' email alerts--click here.


